Downloads
Download


This work is licensed under a Creative Commons Attribution 4.0 International License.
Article
Optical Study on Soot Formation of Ethanol/hydrogenated Catalytic Biodiesel/octanol Blends
Shufa Zhou 1, Wenjun Zhong 1,*, Tamilselvan Pachiannan 2, Qing Liu 1, Feibin Yan 1, Jiafeng Chen 1, Zhixia He 2, and Qian Wang 1
1 School of Energy and Power Engineering, Jiangsu University, Zhenjiang 212013, China
2 Institute for Energy Research, Jiangsu University, Zhenjiang 212013, China
* Correspondence: wj_zhong@ujs.edu.cn
Received: 5 September 2023
Accepted: 2 November 2023
Published: 28 November 2023
Abstract: The incorporation of alcohol-based fuel is pivotal in attenuating soot emissions arising from highly reactive hydrocarbon-based fuels. To elucidate the mechanism through which ethanol curtails soot formation in hydrogenated biodiesel, an experimental inquiry was undertaken by employing the high-frequency background light extinction technique within a constant volume combustion chamber system. The primary objective of this study was to scrutinize the impact of blending ethanol with highly reactive fuel on soot generation. Empirical evidence shows that ethanol, owing to its substantial oxygen content, has the potential to facilitate soot oxidation. Incorporating ethanol effectively diminishes soot formation in aspects of quantity, rate, and area. The initial time and location of soot formation increase as the ethanol blending ratio increases. The influence of latent heat of evaporation and Cetane Number on the initial time and location of soot formation varies with distinct environmental temperatures. At 750 K, the latent heat of evaporation exhibits a more pronounced influence in contrast to the Cetane Number. As the temperature rises, the Cetane Number gradually becomes more influential. At a temperature of 825 K and an oxygen content of 21%, the E30H60O10 blend shows an increase of 21.2% and 21.4% in the initial time and location of soot formation, respectively, compared to the E15H75O10 mix. Furthermore, there is a reduction of 75.8% in the total soot mass.
Keywords:
ethanol hydrogenated catalytic biodiesel soot constant volume combustion chamber1. Introduction
Diesel engines hold a pivotal role in China's economic advancement, particularly in the transportation sector. The compression ignition mode via direct injection stands as a crucial technology for attaining efficient combustion. However, conventional fossil fuels impose substantial strains on environmental issues and energy security [1]. In addition, it is important to note that diesel combustion is known for its high levels of particulate matter (PM) emissions. These emissions have been found to have significant environmental consequences and can also have detrimental effects on human health [2]. In recent times, with escalating concerns over environmental pollution and the emergence of the "carbon peaking and carbon neutrality" development strategy, the pursuit of energy efficiency and emission reduction in internal combustion engines has gained heightened attention from researchers. Notably, biofuels offer a viable means to mitigate the greenhouse gas emissions resulting from the combustion of fossil fuels, thereby addressing the issue of global warming [3]. Biofuels substantially expand the potential utility of diesel engines, notably through their capacity to generate low carbon emissions and support economic security [4].
Biofuels are widely recognized for their effectiveness in mitigating particulate number (PN) and PM emissions [5,6]. In comparison to biodiesel, alcohol fuels offer a more significant advantage in reducing particulate matter emissions, this is primarily due to their oxygenated and volatile properties [7], and studies have shown that this is due to a more significant inhibitory effect on polycyclic aromatic hydrocarbon (PAH) formation than oxidation [8]. The viscosity and density of alcohols do not provide any advantages compared to biodiesel in terms of improving fuel atomization. However, alcohols have lower Cetane Numbers (CN), higher latent heat of evaporation, and autoignition temperatures, which allow them to enhance ignition delay (ID) and promote effective mixing of fuel and air. Moreover, it is worth noting that alcohols exhibit a favorable boiling point, which enables efficient fuel evaporation. Additionally, their unique combination of oxygen content and carbon-to-hydrogen ratio facilitates low soot combustion [9]. Furthermore, alcohols possess renewable characteristics, high octane ratings, and excellent anti-explosive properties and the above advantages make alcohols promising for development. Thus, the combination of hydrogenated catalytic biodiesel and methanol has been observed to effectively reduce the formation of soot [10]. Similarly, the mixing of n-dodecane and pentanol has exhibited the ability to maintain a lower level of soot emission in the blended fuel [11]. Ethanol is regarded as a viable alternative fuel for utilization in compression-ignition engines, and it can be derived from biomass [12].
The utilization of ethanol as a direct substitute for diesel encounters certain technical obstacles due to its inherent characteristics, notably its low Cetane Number and flash point [13]. Incorporating ethanol into spark ignition engines (SIEs) can give rise to challenges during cold starts [14]. Additionally, employing ethanol in its pure form yields a reduced energy density within the engine [15]. Zhou et al. [16] used high-speed imaging to investigate the dynamic collision behaviour of a single hydrous ethanol droplet in different water/ethanol ratios on a heated horizontal glass surface, and showed that as the ethanol mass fraction increased from 0% to 100%, the superheat limit temperature decreased by approximately 80 K, while the Leidenfrost temperature decreased by at least 100 K. Zervas et al. [17] revealed that ethanol usage results in higher emissions of methanol, acetic acid, acetaldehyde, and ethanol itself. It has also been shown that the high latent heat of vaporization of ethanol can cause carbon deposits on the back of the intake valve [18]. Studies by domestic and international scholars have shown that the application of ethanol faces several challenges.
Specifically, the direct utilization of ethanol can engender a sequence of issues, including suboptimal ignition performance and combustion instability. These issues can be mitigated through the incorporation of ethanol into blends with highly reactive fuels. Notable examples of such fuels include biodiesel, diesel, and dimethyl ether. To date, many studies have explored the utilization of ethanol blending with highly reactive fuels. For instance, Öztürk et al. [19] explored the impact of ethanol augmentation on combustion, performance, and emissions in direct injection diesel engines with the blends of rapeseed oil biodiesel and diesel. Their findings indicated that the inclusion of ethanol correlated with diminished emissions of total hydrocarbons (THC) and carbon monoxide (CO). Janakiraman et al. [20] analyzed an experimental study of ternary (diesel + biodiesel + bioethanol) fuel blended with metal-doped titanium oxide nano-additives, which would reduce emissions and improve the performance of diesel engines. Zheng et al. [21] introduced 20% ethanol to biodiesel as a means to diminish both NOx and soot emissions. Similarly, Padala et al. [22] substantiated that elevating the ethanol content in fuel blends enhances engine efficiency. Shadidi et al. [23] explored the emission attributes of diesel-ethanol blends, with findings highlighting the substantial reduction of CO and hydrocarbons (HC) emissions consequent to ethanol incorporation. Chen et al. [24] investigated the combustion and emission characteristics of diesel/ethanol dual fuel engines and the results showed that the addition of ethanol to diesel delayed the ignition time with reduced particulate emissions, while in the study by Kurre et al. [25] as the percentage of ethanol in the fuel blend increased, the exhaust temperature and BSFC increased, and the emissions of NOx, CO2 and CO decreased. Ethanol has demonstrated notable efficacy across several of the aforementioned studies.
One of the second-generation biodiesels known as Hydrogenated Catalytic Biodiesel (HCB), is derived from gutter oil and waste grease through a hydrocatalytic process. HCB has garnered significant attention due to its attributes, including low sulfur content, diminished corrosiveness, elevated calorific value, high Cetane Number, and exceptional ignition characteristics. An et al. [26] conducted combustion and emission tests on engines, revealing diminished emissions of HC and CO2. Additionally, they observed reductions in NOx emissions under most operational conditions. The utilization of HCB was demonstrated to be effective in curbing NOx emissions in comparison to pure diesel, which also contributed to lowered CO2 emissions. Lapuerta et al. [27] investigated combustion and emission attributes by blending HCB with diesel fuel. Their findings demonstrated a substantial reduction in soot as the proportion of HCB within the blend increased. Similarly, Aatola et al. [28] compared combustion and emission results of diesel, HCB, and diesel/HCB blends, observing that the incorporation of HCB was equally effective in diminishing soot emissions. Zhai et al. [29] indicates that reducing the hole diameter and increasing injection pressure can inhibit soot generation more effectively. Zhong et al. [30] blended HCB with gasoline in varying ratios and investigated the combustion and emission attributes across different workloads. Their findings indicated that the introduction of HCB resulted in lowered emissions of HC and NOx. Many studies found that HCB has good combustion and emission characteristics, since it is a macromolecular hydrocarbon fuel with high soot emissions, the ethanol blending scheme was considered to reduce its soot generation.
However, ethanol and hydrogenated catalytic biodiesel blend soot generation characteristics have not been reported yet, so this study uses ethanol/hydrogenated catalytic biodiesel/octanol blend to conduct visualization experimental studies at different ambient temperatures, different oxygen concentrations, and different injection pressures in a constant volume combustion chamber system using the high-frequency background light extinction method. This study compares and analyzes the effects of ethanol addition on the soot generation development process and generation quality, which will provide theoretical support for the application of ethanol in direct injection compression ignition mode.
2. Experiment Setup and Conditions
2.1. Constant Volume Combustion Chamber
All experiments in this paper were conducted within a constant volume combustion chamber system. Detailed information about the equipment can be found in the literature [31]. The constant volume combustion chamber system comprises the chamber body, data acquisition system, intake and exhaust system, fuel supply system, heating system, cooling system, and control system. The combustion chamber operates at a maximum temperature of 1000 K and a maximum pressure of 6 MPa. Four 100 mm diameter windows are symmetrically arranged around the chamber to serve as optical channels. Highly transparent quartz glass is inserted into these windows to facilitate visualization for the study.
2.2. High-Frequency Background Light Extinction
The high-frequency background light extinction method is employed for measuring the soot formation process, with the experimental setup's schematic depicted in Figure 1. The light source is of 446 nm high-frequency pulsed light-emitting diode (LED), the diameter and focal length of the Fresnel lens is 100 mm and is placed in between the LED and the diffuser. To reduce the schlieren effect, the diffuser is placed close to the window. The pulsed LED signal and high-speed digital camera timing principle are shown in Figure 2. The frequency of the camera signal is twice the frequency of the LED, so that the high-speed camera can capture an image of the soot itself radiating light when it is exposed to LED.
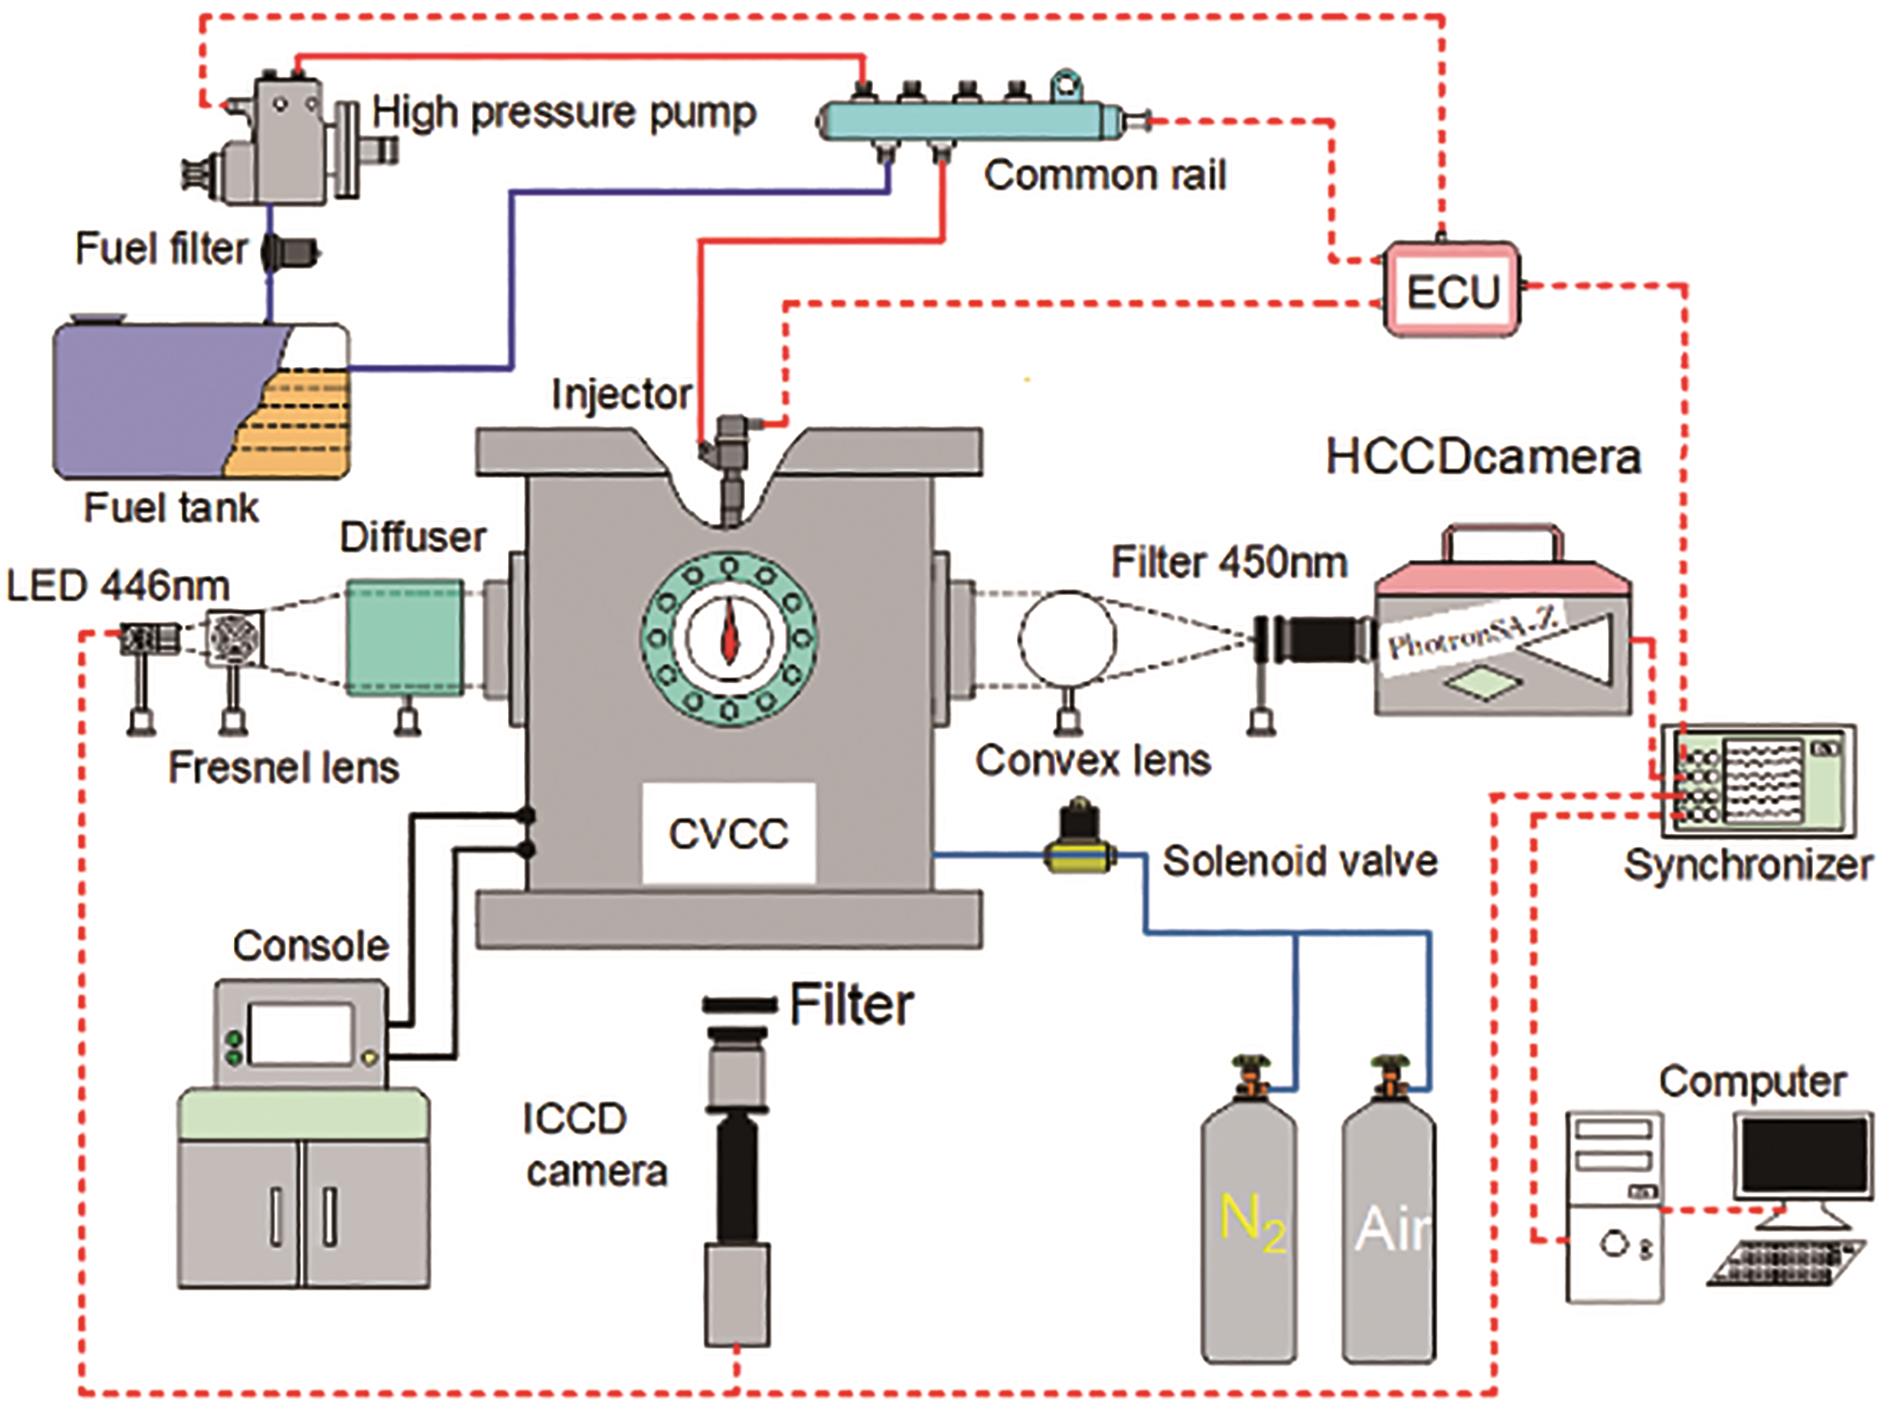
Figure 1. Schematic of optical setup.
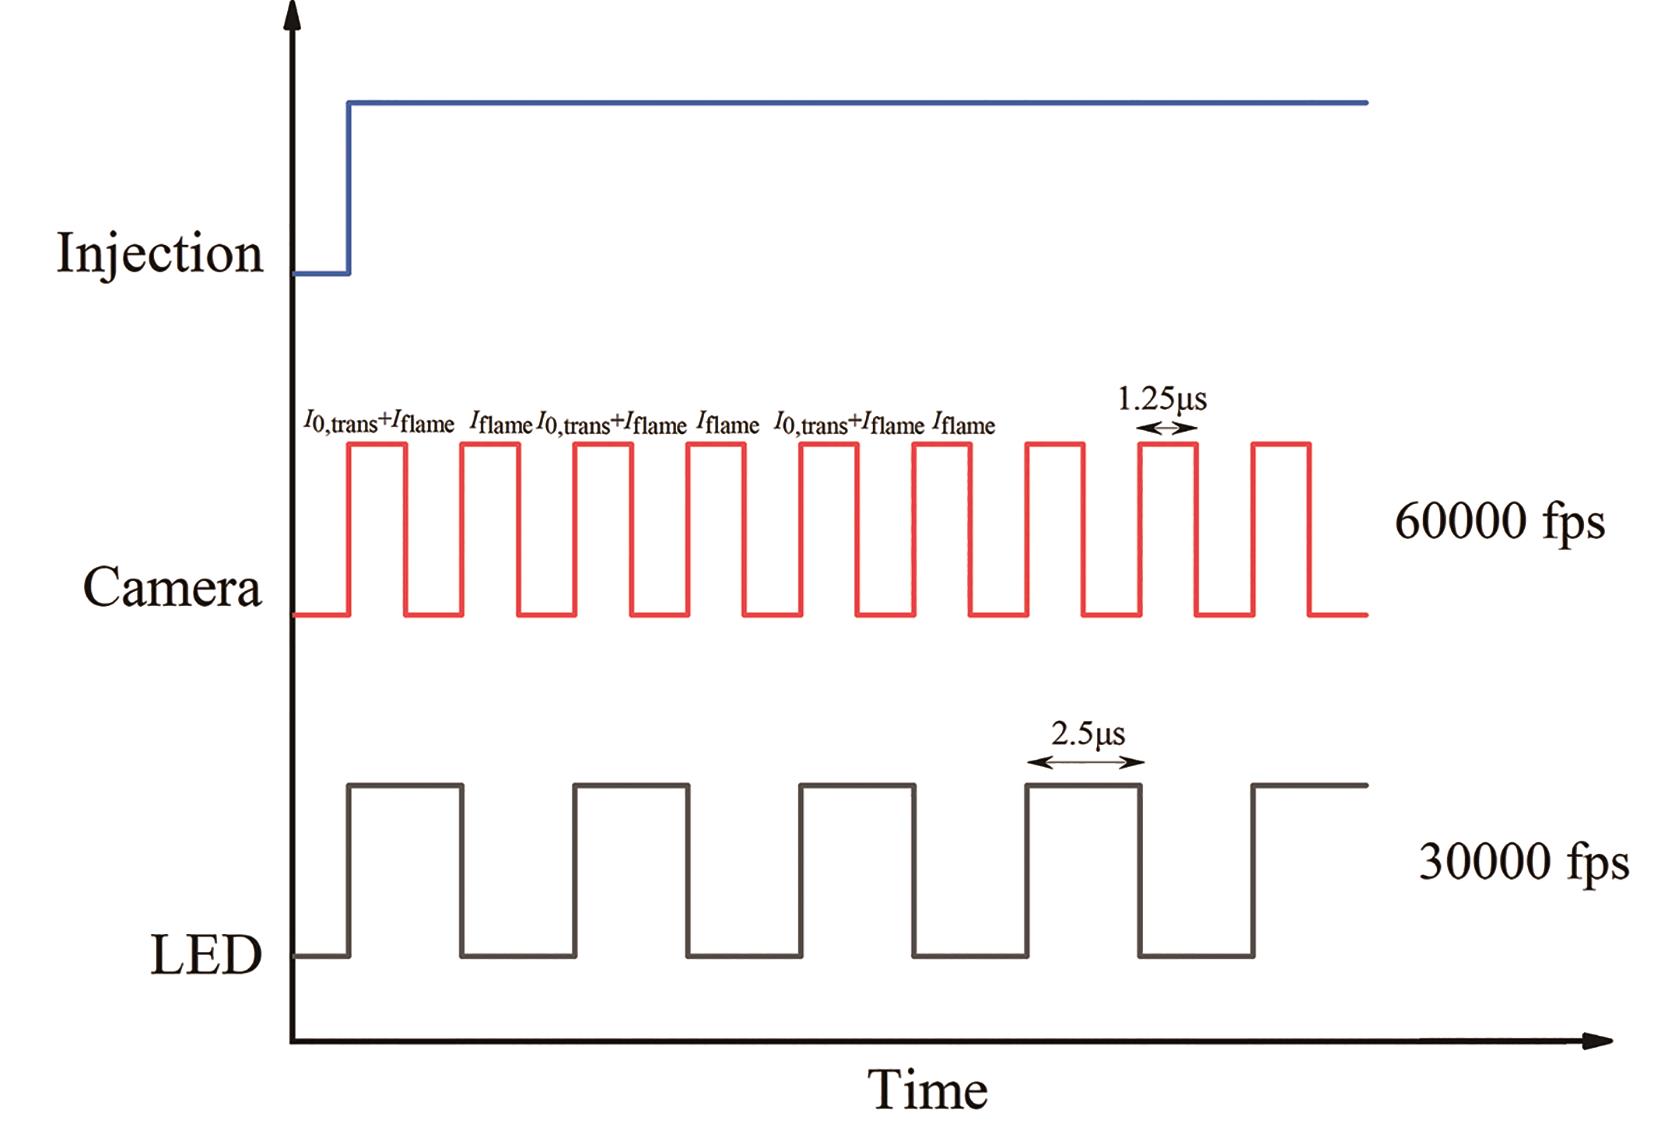
Figure 2. Timing schematic of pulse light-emitting diode (LED) and high-speed digital camera.
The high-frequency background light extinction method provides light intensity images at each time instance, enabling the calculation of the optical thickness KL value that represents soot concentration. The calculation is based on Beer-Lambert's law by Equation (1).

Within this equation, I0 represents the incident light intensity of the LED lamp; Iflame signifies the radiant light intensity emitted by the soot itself when the LED light source is exposed; Isum represents the cumulative light intensities of I0,trans and Iflame after the penetration of the incident light source through the soot cloud. Here, K stands for the spatial extinction coefficient, while L pertains to the optical thickness of the incident light within the soot. Moreover, the volume fraction of soot exhibits a positive correlation with the spatial extinction coefficient K [32], as depicted in Equation (2).

Here, fv represents the volume fraction of soot, λ denotes the incident wavelength (λ = 450 nm), and ke stands for the dimensionless extinction coefficient. The value of ke is adopted as 7.61 in accordance with the Rayleigh-Debye-Gans (RDG) theory and the research conducted by Koylu et al. regarding the extinction coefficient [33].
Then the soot mass can be obtained by multiplying the soot volume fraction with the soot density, which is taken as ρ=1.8 g/cm3 in this paper [34]. Then the soot mass can be presented by Equation (3).

In where,  soot signifies the soot mass and A denotes the area of the soot region. Utilizing Equation (1) and MATLAB, the soot concentration cloud map over time, along with the corresponding KL values, can be generated, as illustrated in Figure 3. From Figure 3b, the green line illustrates the KL distribution along the spray central axis at a specific instance, while the red line signifies the KLsat value the theoretical maximum attainable KL value at that moment, calculated using Equation (4).


Figure 3. Distribution of KL values in soot.
where Imin represents the minimum light intensity that permeates the soot when the LED is deactivated. As depicted in Figure 3, the KL curve exhibits two peaks along the spray central axis, corresponding to the liquid length and the distribution of soot concentration, moving from left to right.
2.3. Fuels Properties and Test Conditions
For this experiment, National VI 0# diesel, E15H75O10, and E30H60O10 fuel are used. E15H75O10 fuel is a blend of 10% octanol, 15% ethanol, and 75% HCB prepared through volume-based proportions. Similarly, for E30H60O10, a mixture of 10% octanol, 30% ethanol, and 60% HCB was prepared. Since ethanol and HCB are not directly miscible, n-octanol served as a co-solvent to enhance their blend's miscibility. To ensure n-octanol's properties didn't influence the outcomes, fuel ethanol, and HCB were introduced into a small volume (10%) of n-octanol and mixed using ultrasonic cleaning. Table 1 presents the calculated density, viscosity, latent heat of vaporization, Cetane Number, and low heating value for the diesel, ethanol, octanol, and HCB fuels. And also, for the tested fuel blends and is calculated based on previous studies [35].
Table 1. Main physicochemical properties of the two test fuels.

The purpose of this study is to experimentally investigate the soot generation characteristics of ethanol/HCB blends at different ambient temperatures, ambient oxygen concentrations, and injection pressures; And to compare and analyze it with the results of National VI 0# diesel fuel, to explore the effects of the ethanol blending ratio as well as the different ambient conditions and injection pressures on the soot generation. To reduce the test uncertainty, and considering that the previous injection has a greater influence on the next injection, the test results are the measure of 10 injections for each working condition. The specific experimental program is shown in Table 2, and the final experimental results are obtained by averaging the results of the 10 injections.
Table 2. Soot test program.

2.4. Uncertainty Analysis
The errors and uncertainties can be caused by various factors, such as the experimental operation method, instrument calibration, working conditions, and environmental conditions [36]. Uncertainty analysis is vital for quantifying the uncertainty in measured data. Uncertainty analysis was performed using the root sum-square method described by Moffat [37], as shown below in Equation (5):

where δR is the overall uncertainty of the result, δXi is the uncertainty in the variable. Each term has the same form: the partial derivative of R with respect to Xi multiplied by the uncertainty interval for the variables.
3. Results and Discussion
3.1. The Process of Development of Soot Concentration in Flames
This section shows how the ethanol addition impacts the soot generation characteristics of blended fuels and their influence on soot concentration development, by analyzing the three fuels of Diesel, E15H75O10, and E30H60O10. This study aims to offer theoretical backing for upcoming engine bench tests. Figure 4 shows the evolution of soot concentrations for the three test fuels under specific conditions: 100 MPa injection pressure, 750 K ambient temperature, 21% oxygen concentration, and 5 MPa ambient pressure. These stages encompass soot generation, development, and dissipation. Among these, higher numerical values on the color bar correspond to a greater KL factor, indicating higher soot concentrations.
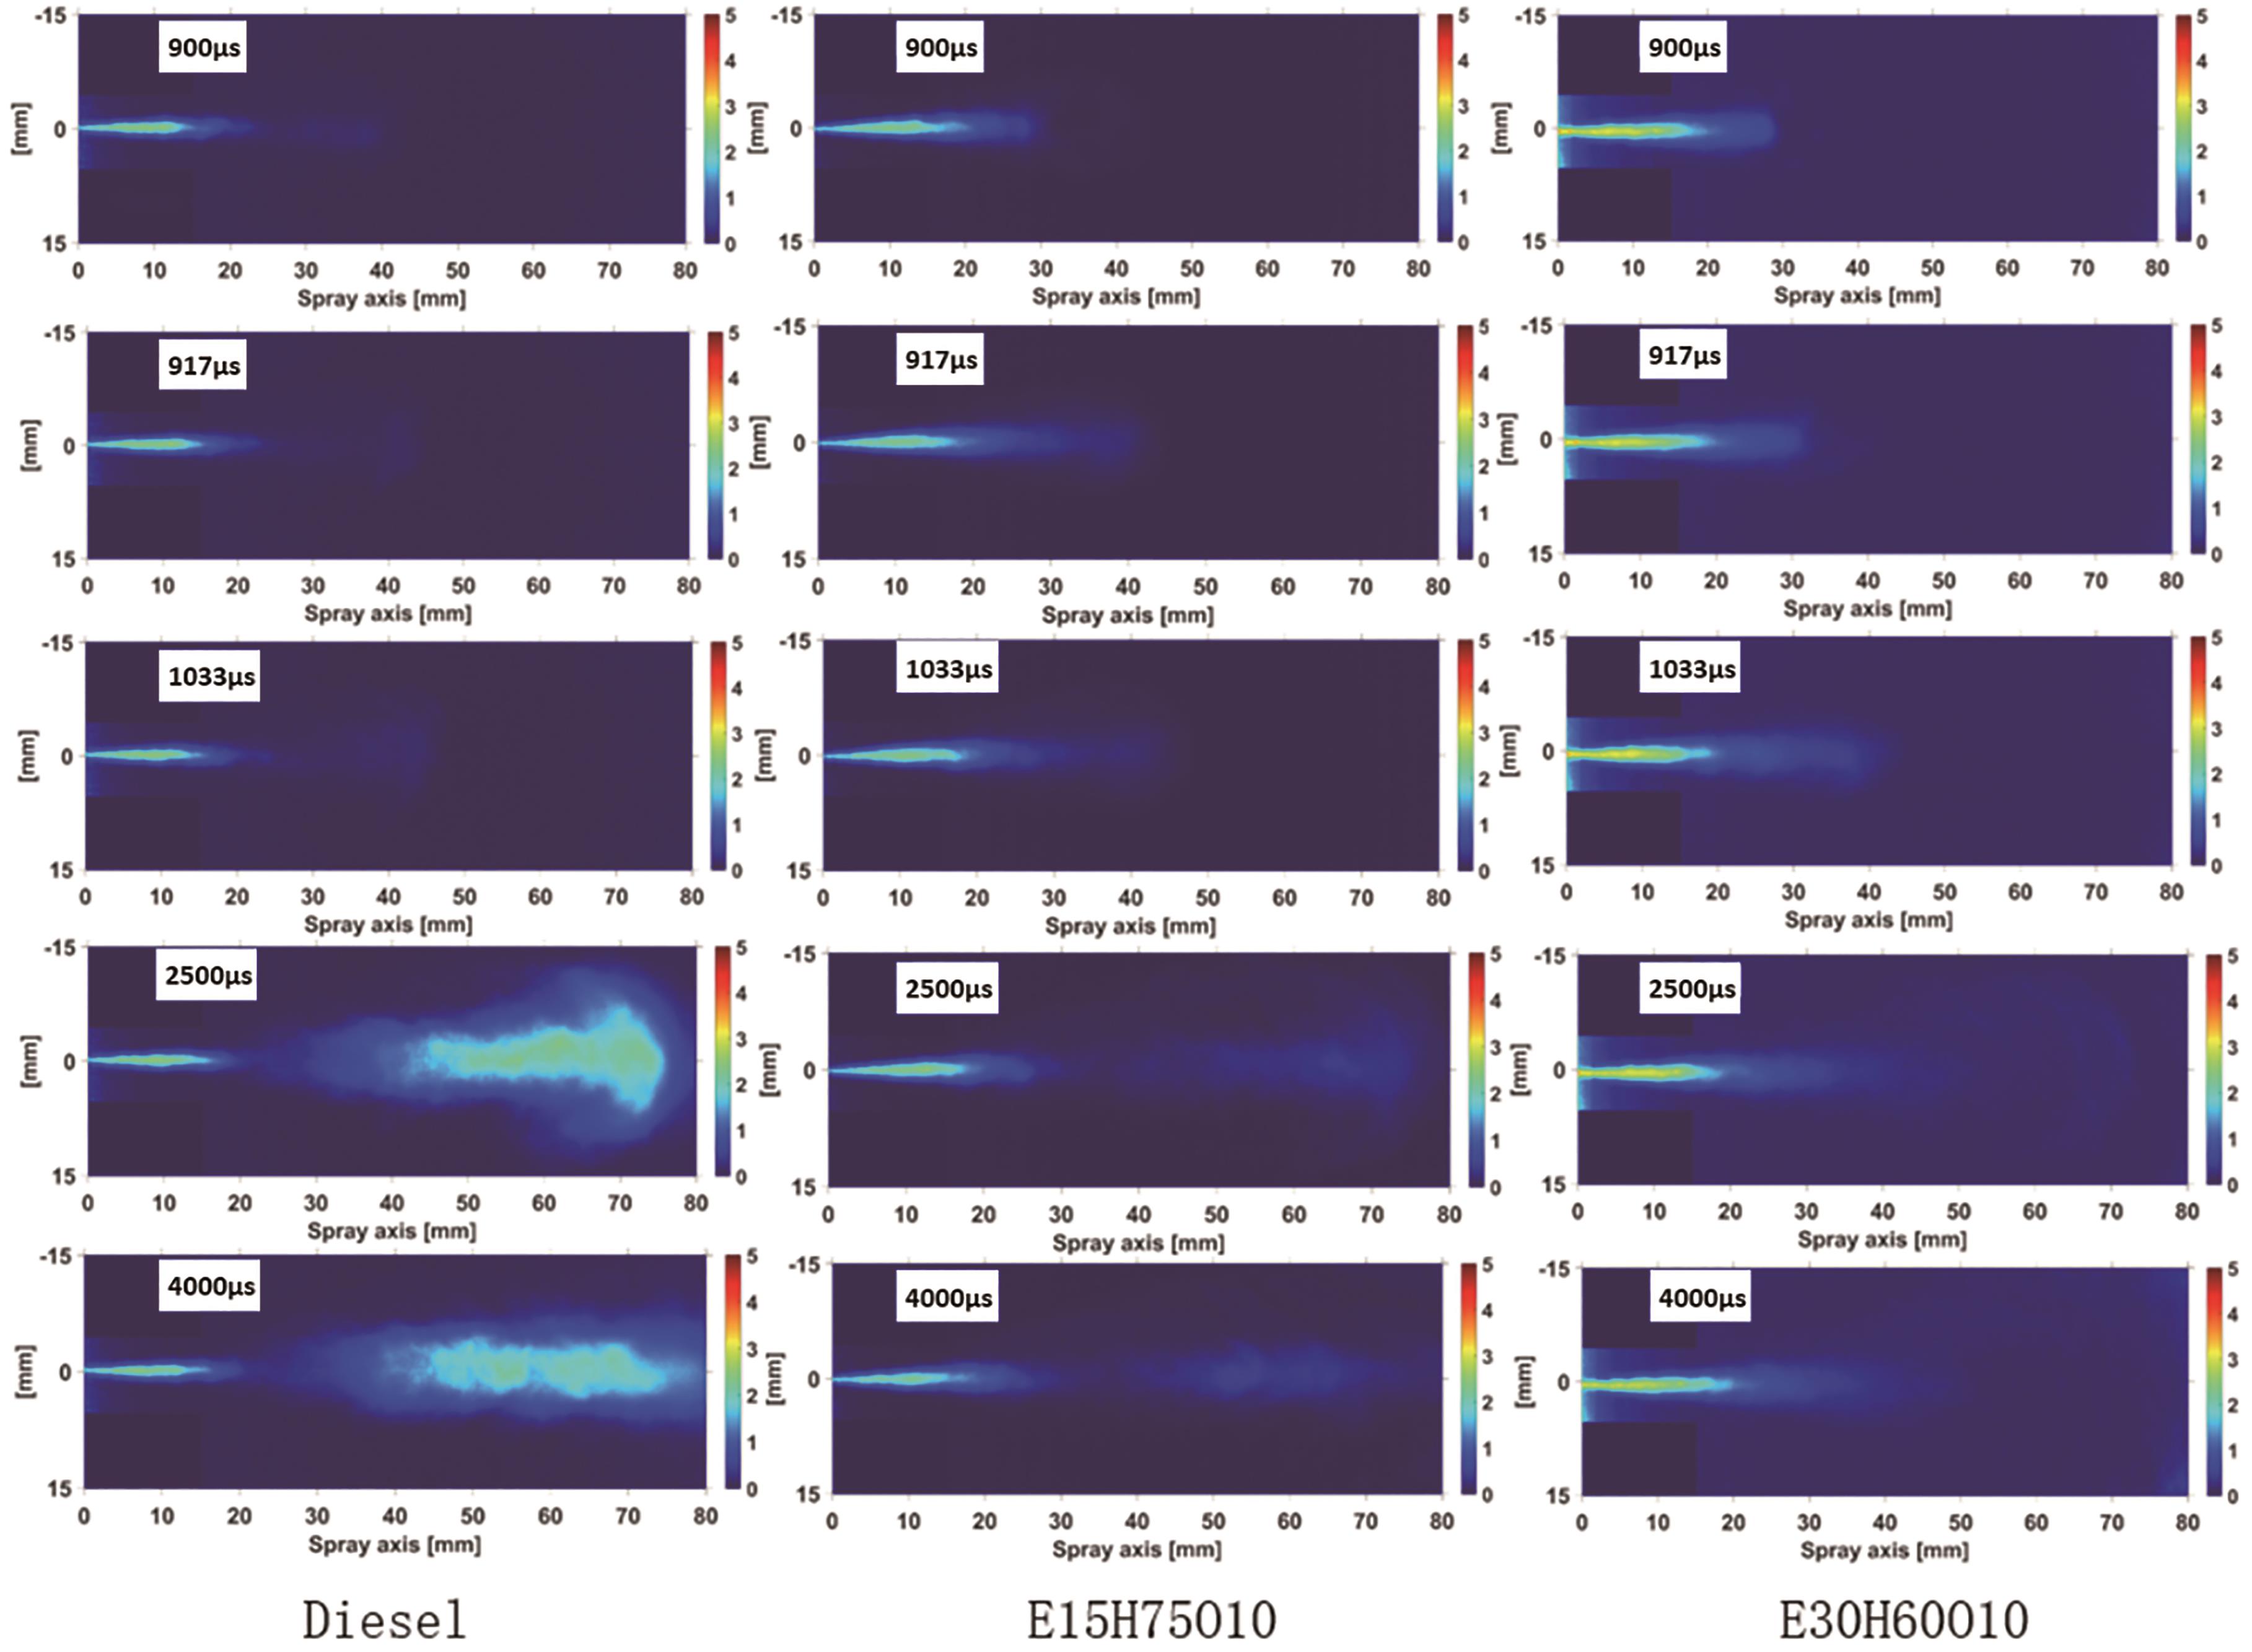
Figure 4. Two-dimensional distribution of Diesel, E15H75O10 and E30H60O10 soot concentrations. (At ambient temperature of 750 K, ambient pressure of 5 MPa, oxygen concentration of 21%, and injection pressure of 100 MPa).
From Figure 4, it can be seen that the initial times of soot are 900 μs, 917 μs and 1033 μs for Diesel, E15H75O10 and E30H60O10 fuels, respectively. This indicates that the addition of ethanol prolongs the initial times of soot formation. Notably, the overall soot development process shows that the E30H60O10 blended fuel yields the lowest amount of soot. This phenomenon can be attributed to several key factors. Firstly, ethanol exhibits a low Cetane Number, and elevating the ethanol proportion results in a corresponding reduction in the Cetane Number of the fuel blend. This decrease weakens the reactivity of the blend and diminishes the rate of fuel cracking, leading to a reduction in the production of soot precursors. Secondly, ethanol possesses a high latent heat of vaporization (LHV), which is further magnified by an augmented ethanol blending proportion, consequently boosting the overall LHV of the fuel blend. The combined influence of these factors extends the ignition delay time, directly causing a lengthening of the initial soot formation time. Concurrently, the extended ignition delay period provides an additional opportunity for thorough mixing between the air and fuel blend, enhancing the pre-mixing combustion effect and reducing the partial equivalence ratio in the region of soot generation and causing the mixed fuel to burn more fully, reducing soot production. Figure 4 illustrates that as time progresses, the soot fronts advance forward and simultaneously spread radially, creating a distinctive "spindle" soot pattern. During this process, the soot concentration of Diesel markedly diminishes, while E15H75O10 and E30H60O10 blends maintain consistently low soot concentrations. This phenomenon arises from the extension of the soot generation region over time, facilitating air contact with unoxidized soot within the "spindle." Consequently, substantial oxidization of the soot occurs, leading to a noteworthy reduction in soot concentration. However, for the two fuels, E15H75O10 and E30H60O10, which contain oxygen by themselves, the reduction of soot concentration due to the increase in the contact area with air is not significant.
At the time point of ASOI 2500 μs, the soot front approaches the optical window of the constant volume combustion chamber. This specific moment was selected to compare the soot concentration between two fuels, E15H75O10 and E30H60O10, at different ambient temperatures. As depicted in Figure 5, the rise in ambient temperature prominently influences soot production, while an increase in the proportion of blended ethanol in the fuel mixture significantly reduces the generated soot quantity. The figure reveals that, in comparison to the E30H60O10 blended fuel, the E15H75O10 blended fuel exhibits a higher soot concentration and area at the same temperature. This trend becomes more pronounced with rising temperatures. Two primary factors contribute to this trend. First, as temperature increases, oxygen consumption accelerates, enlarging the diffusion combustion area and consequently expanding the region of soot formation. Second, the oxygen-rich nature of ethanol significantly influences soot reduction. As the proportion of ethanol in the blended fuels increases, the oxygen content of the blends rises. This rise effectively mitigates local oxygen deficiency, directly leading to a reduction in soot generation.

Figure 5. Two-dimensional distribution of soot concentration at ASOI 2500 μs, at an oxygen concentration of 21%, and injection pressure of 100 MPa.
3.2. Analysis of the Initial Time and Initial Location of Soot
Figure 6 and Figure 7 show quantitative comparisons of the initial time and initial location of soot generation for three test fuels, Diesel, E15H75O10 and E30H60O10, at different ambient temperatures and different oxygen concentrations, respectively. Among them, the bar graph indicates the initial moment of soot generation, and the line graph indicates the initial location of soot for their corresponding conditions. As depicted in Figure 6, the initial time of soot generation notably decreases with rising temperature, the initial location of soot for the corresponding condition is closer to the nozzle, and this trend is weakened as the temperature increases. The increase in temperature significantly shortens the ignition delay period, increases the local equivalence ratio, and advances the initial time of soot generation. The high-temperature environment is more beneficial to the production of soot precursors, which also results in the advancement of the initial time of soot generation and the initial location of the soot. It is noteworthy that a different trend from high temperatures appears at an ambient temperature of 750 K; This is attributed to the dominance of latent heat of vaporization over Cetane Number at this temperature. Consequently, the initial time exhibits sequential increments. At high temperatures, the influence of cetane number is dominant, while E15H75O10 blended fuel has the highest Cetane Number, the fuel activity is the highest, the easier ignition, the advancement of the initial time of soot generation and the initial location of soot, the Cetane Number of Diesel and E30H60O10 blended fuel is about the same, but the latent heat of vaporization of E30H60O10 blended fuel is much larger, which leads to the decrease of ambient temperatures, so the initial time of soot generation and the initial location of soot of E30H60O10 blended fuel is more backwards.
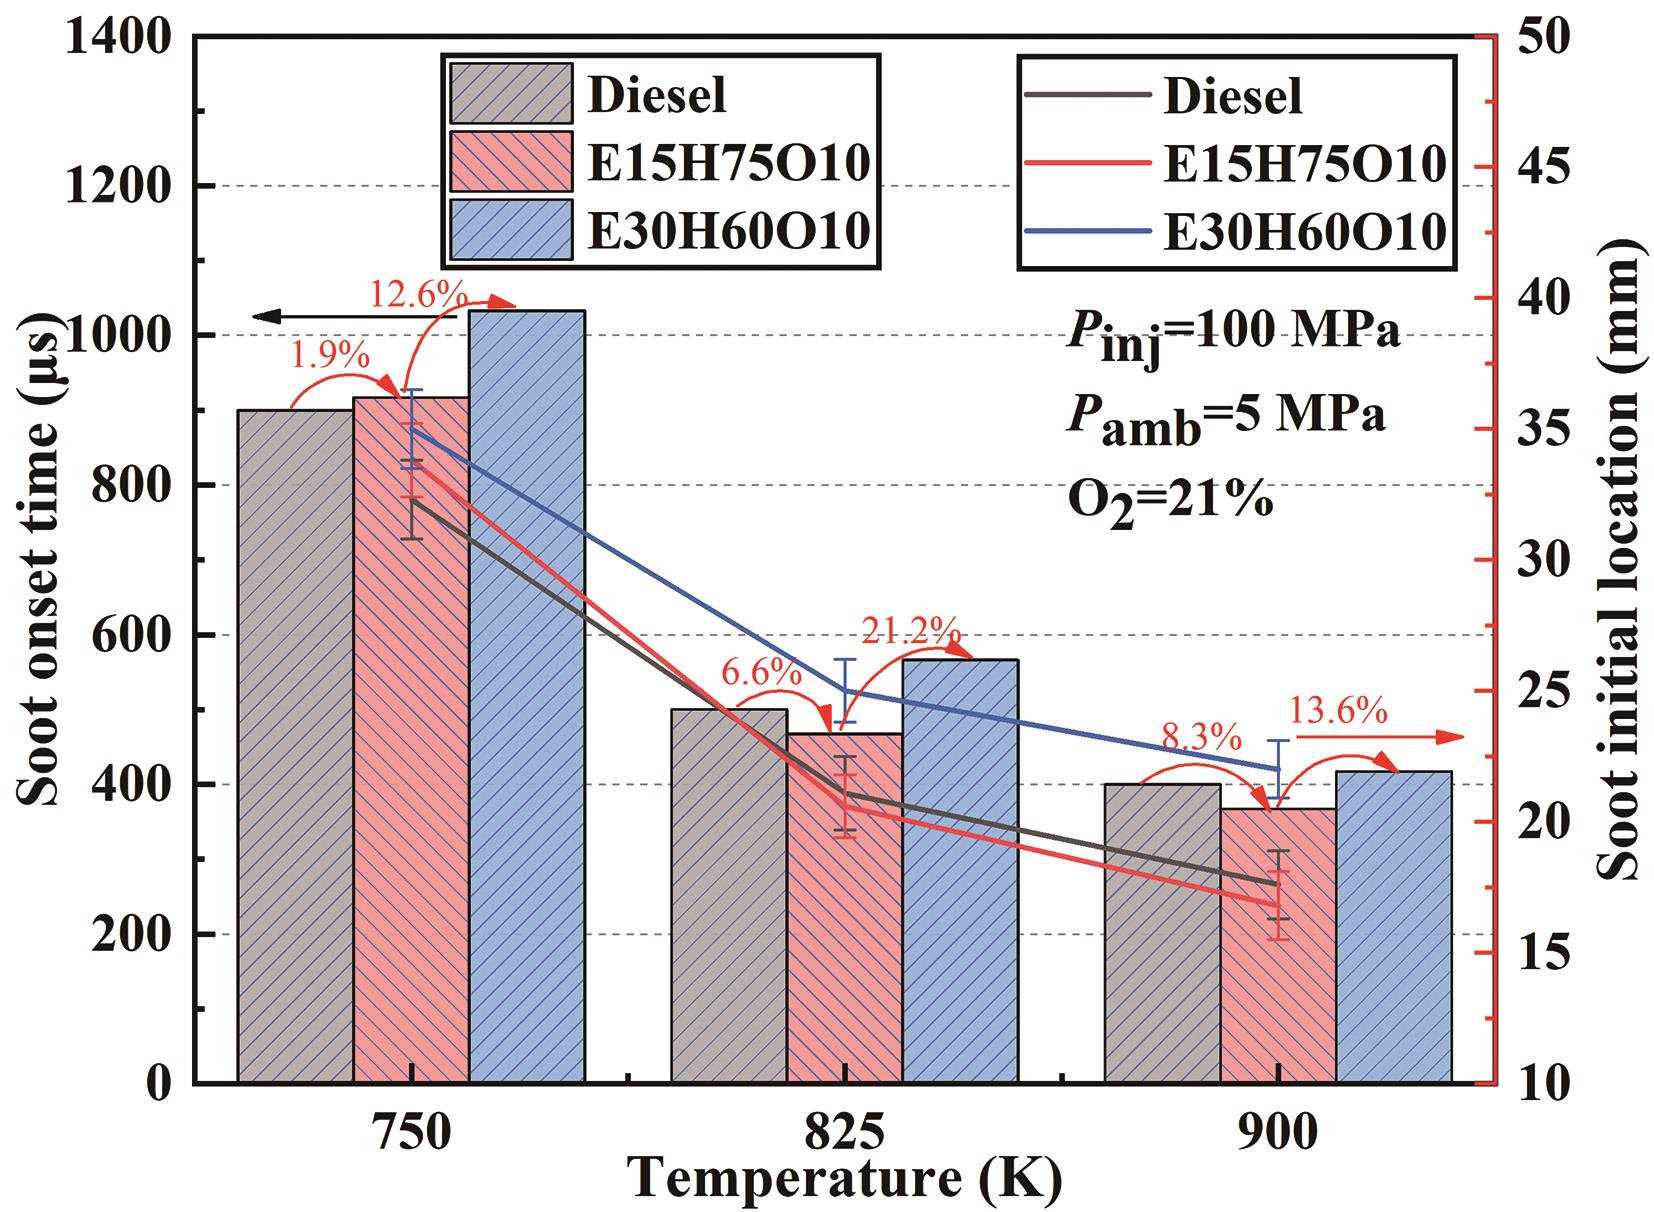
Figure 6. Initial time and initial location of soot generation in the combustion flames of the three fuel types at different temperatures.
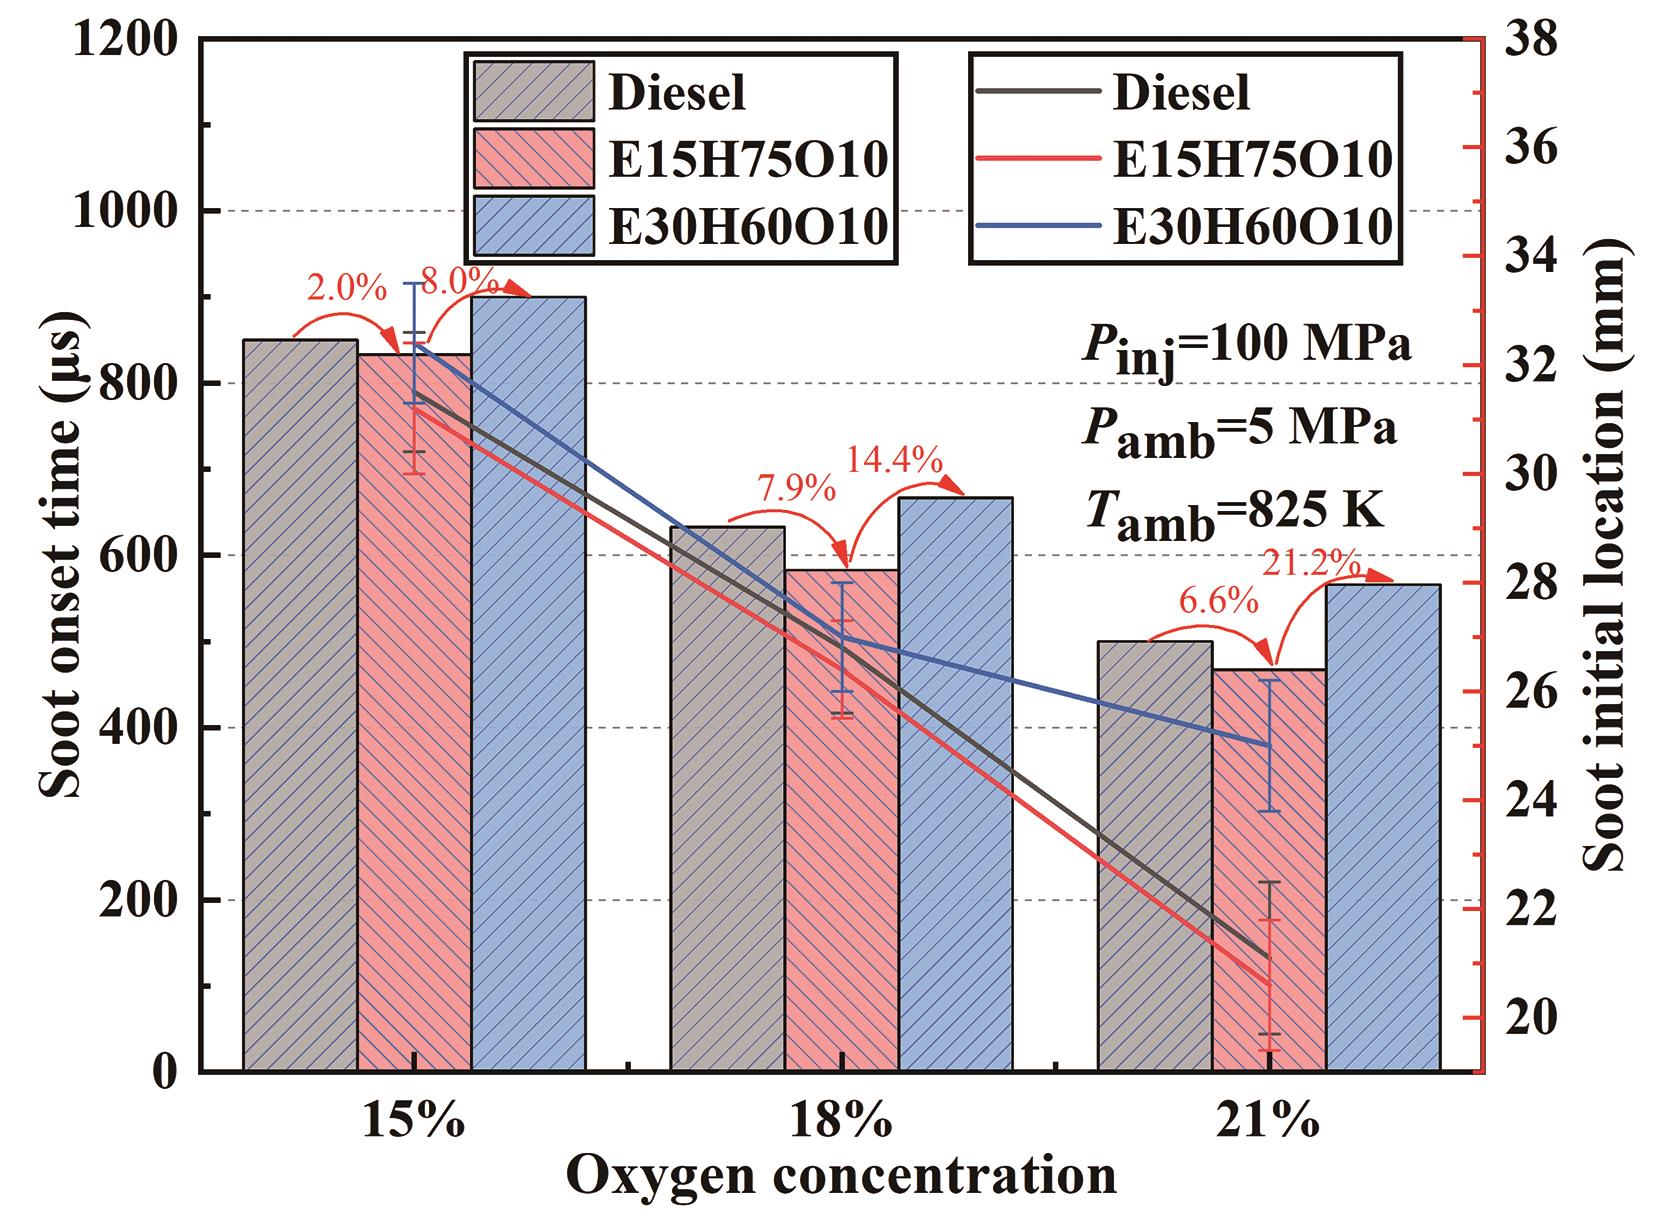
Figure 7. Initial time and initial location of soot generation in the combustion flames of three fuels with different ambient oxygen concentrations.
Figure 7 illustrates the variation curves depicting the initial time and location of soot generation at distinct ambient oxygen concentrations. Evidently, as oxygen concentration rises, the initial time and location of soot generation advance across all three fuels. This phenomenon stems from the fact that heightened oxygen content in the environment results in a correspondingly shortened ignition delay period, thus advancing the initial time of soot generation. Furthermore, the increased oxygen content also reduces the flame lift-off length, leading to the proximity of the soot's initial location to the nozzle. Furthermore, as the ethanol blending ratio increases, the initial time and location of soot generation experience a delay. For instance, at an ambient temperature of 825 K and an ambient oxygen concentration of 21%, the initial time of soot generation for the E30H60O10 blend was delayed by 21.2%, while the initial location increased by 21.4% in comparison to the E15H75O10 blend. Notably, the reduction trend of the soot initial location at 21% oxygen concentration for the E30H60O10 blend is less pronounced compared to the Diesel and E15H75O10 blends. This phenomenon can be attributed to the higher oxygen content resulting from the increased proportion of ethanol in the blends. Consequently, the variation in ambient oxygen concentration is less impactful on the initial time and location of soot generation due to sufficient oxygen availability.
Figure 8 shows the initial time and initial location of soot generation for E30H60O10 blends at 750 K and 825 K ambient temperatures with different injection pressures, respectively. The figure clearly indicates that, when the ambient temperatures are the same, the increase in injection pressure will delay the initial time of soot generation, and there is a corresponding increase in the initial location of soot generation, and the higher the pressure, the more obvious is the increase in the initial location of soot generation. For example, an increase in injection pressure from 75 MPa to 100 MPa at 750 K and 21% ambient oxygen concentration resulted in the initial location of soot increases by 14% for the E30H60O10 blend, and the initial location of soot increases by 19% at 825 K and 15% ambient oxygen concentration. The increase in injection pressure increases the spray penetration distance, which moves the area of soot formation conditions farther away from the nozzle; secondly, the increase in injection pressure results in a longer flame lift-off length, which usually characterizes the stable position of diffusion combustion, meaning that the increase in flame lift-off length causes a delay in the initial location of soot formation.
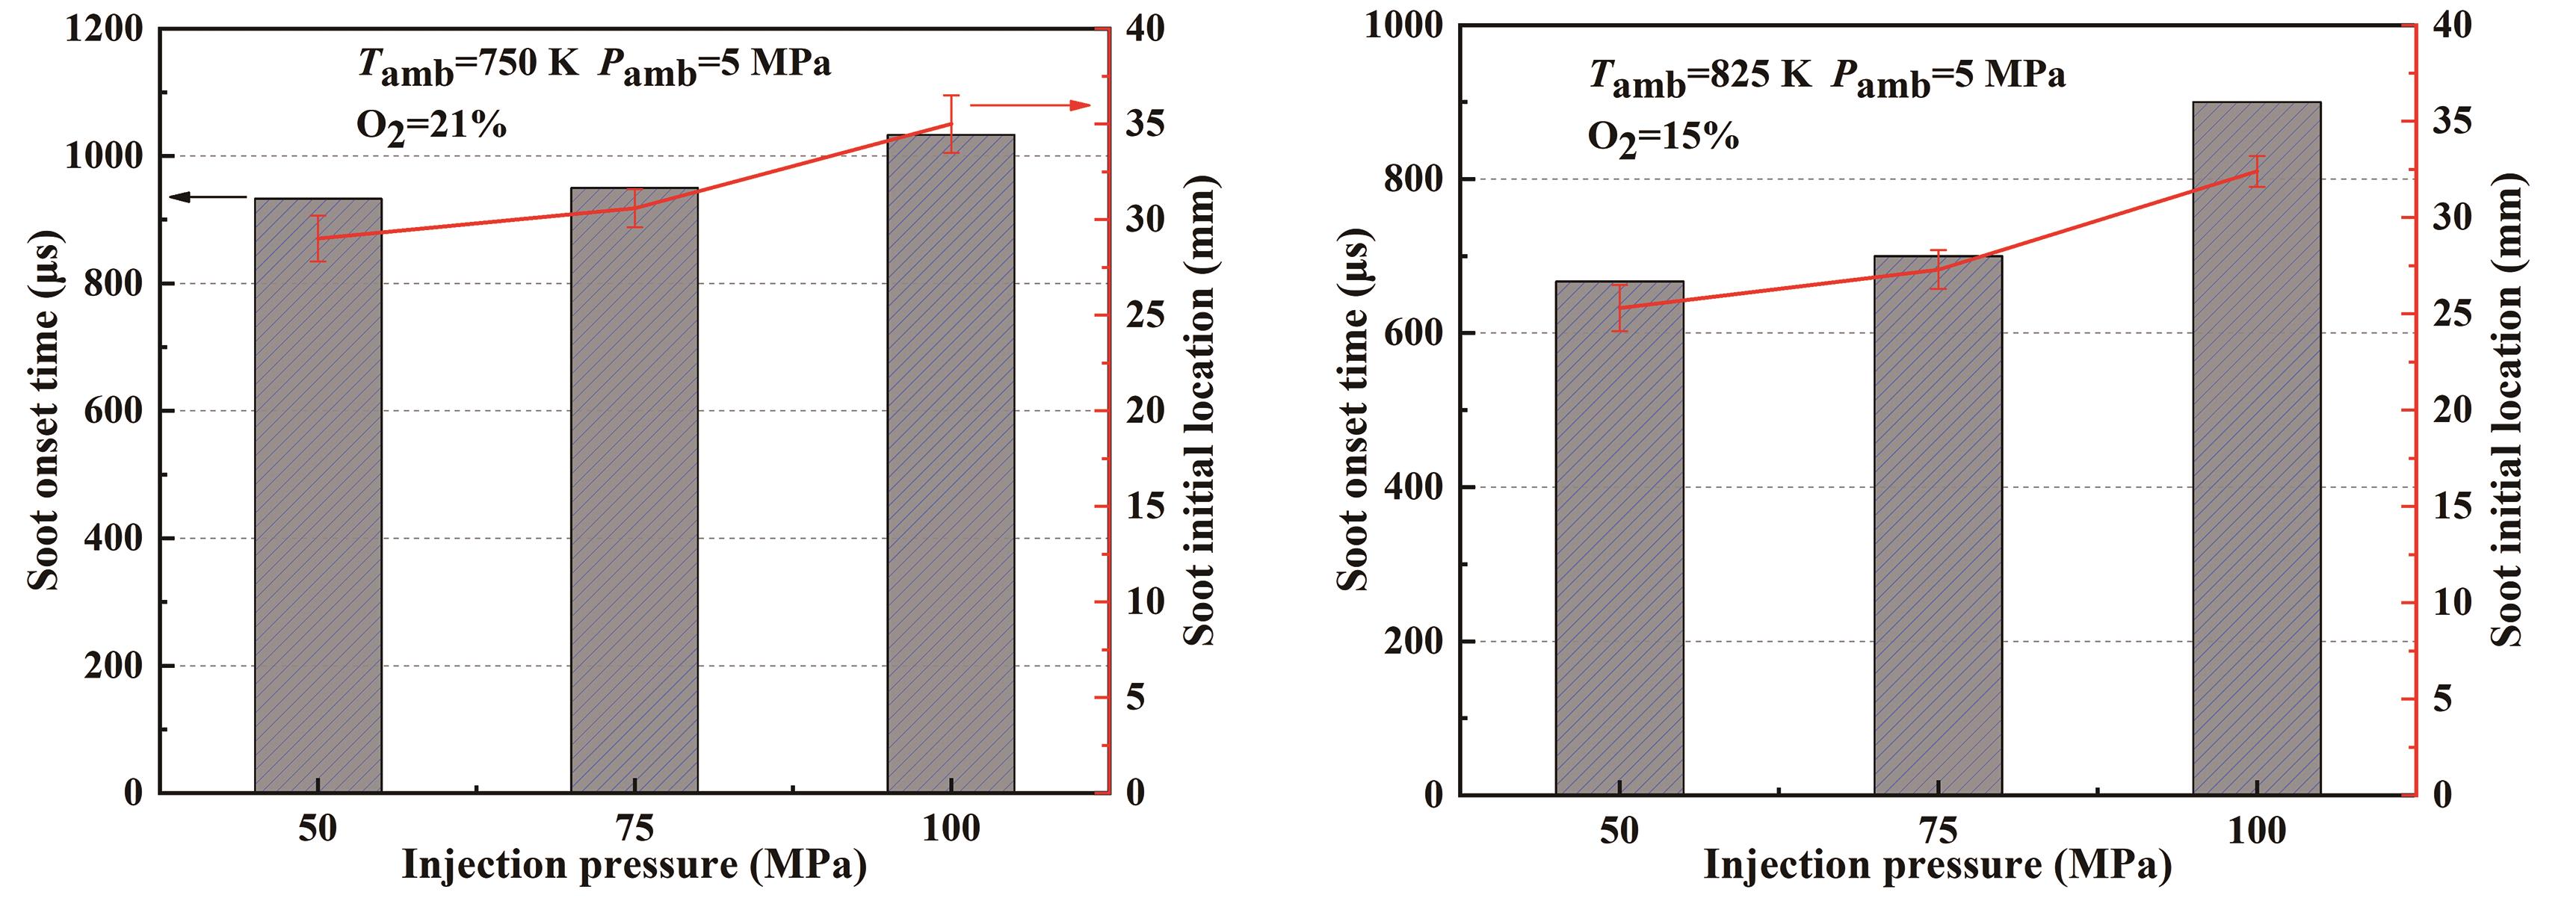
Figure 8. Initial time and initial location of soot generation for E30H60O10 fuel blend at 750 K and 825 K with different injection pressures.
3.3. Soot Mass and Area Transient Characteristics
To understand the soot generation more deeply, this subsection makes a quantitative analysis of the developmental changes of soot over time and the area of the distribution region of soot. Figures 9 and 10 show the development of soot generation quality of the three fuels at different ambient temperatures and different ambient oxygen concentrations, respectively, where the column graphs show the axially accumulated soot quality. It is clear from Figure 9 that the effect of temperature on soot generation is very significant and the quality of soot increases with increase in temperature for all the three fuels and the effect of temperature is greater for the E15H75O10 blend and the E30H60O10 blend compared to the Diesel as the temperature increases. This phenomenon can be attributed to the fact that elevated ambient temperatures notably reduce the ignition delay period of the fuel and largely reduce the degree of spray dispersion, which leads to an increase in the partial equivalence ratio, resulting in a rapid increase in soot mass. Under identical conditions, both the E15H75O10 and E30H60O10 blends exhibited lower soot production than Diesel, with the reduction in soot amount becoming more pronounced as the ethanol blending ratio increased. For instance, at an ambient temperature of 900 K and an ambient oxygen concentration of 21%, the cumulative soot mass of the E30H60O10 blend is 53% less than that of the E15H75O10 blend. Similarly, at an ambient temperature of 825 K and an ambient oxygen concentration of 21%, the reduction amounts to 75.8%.
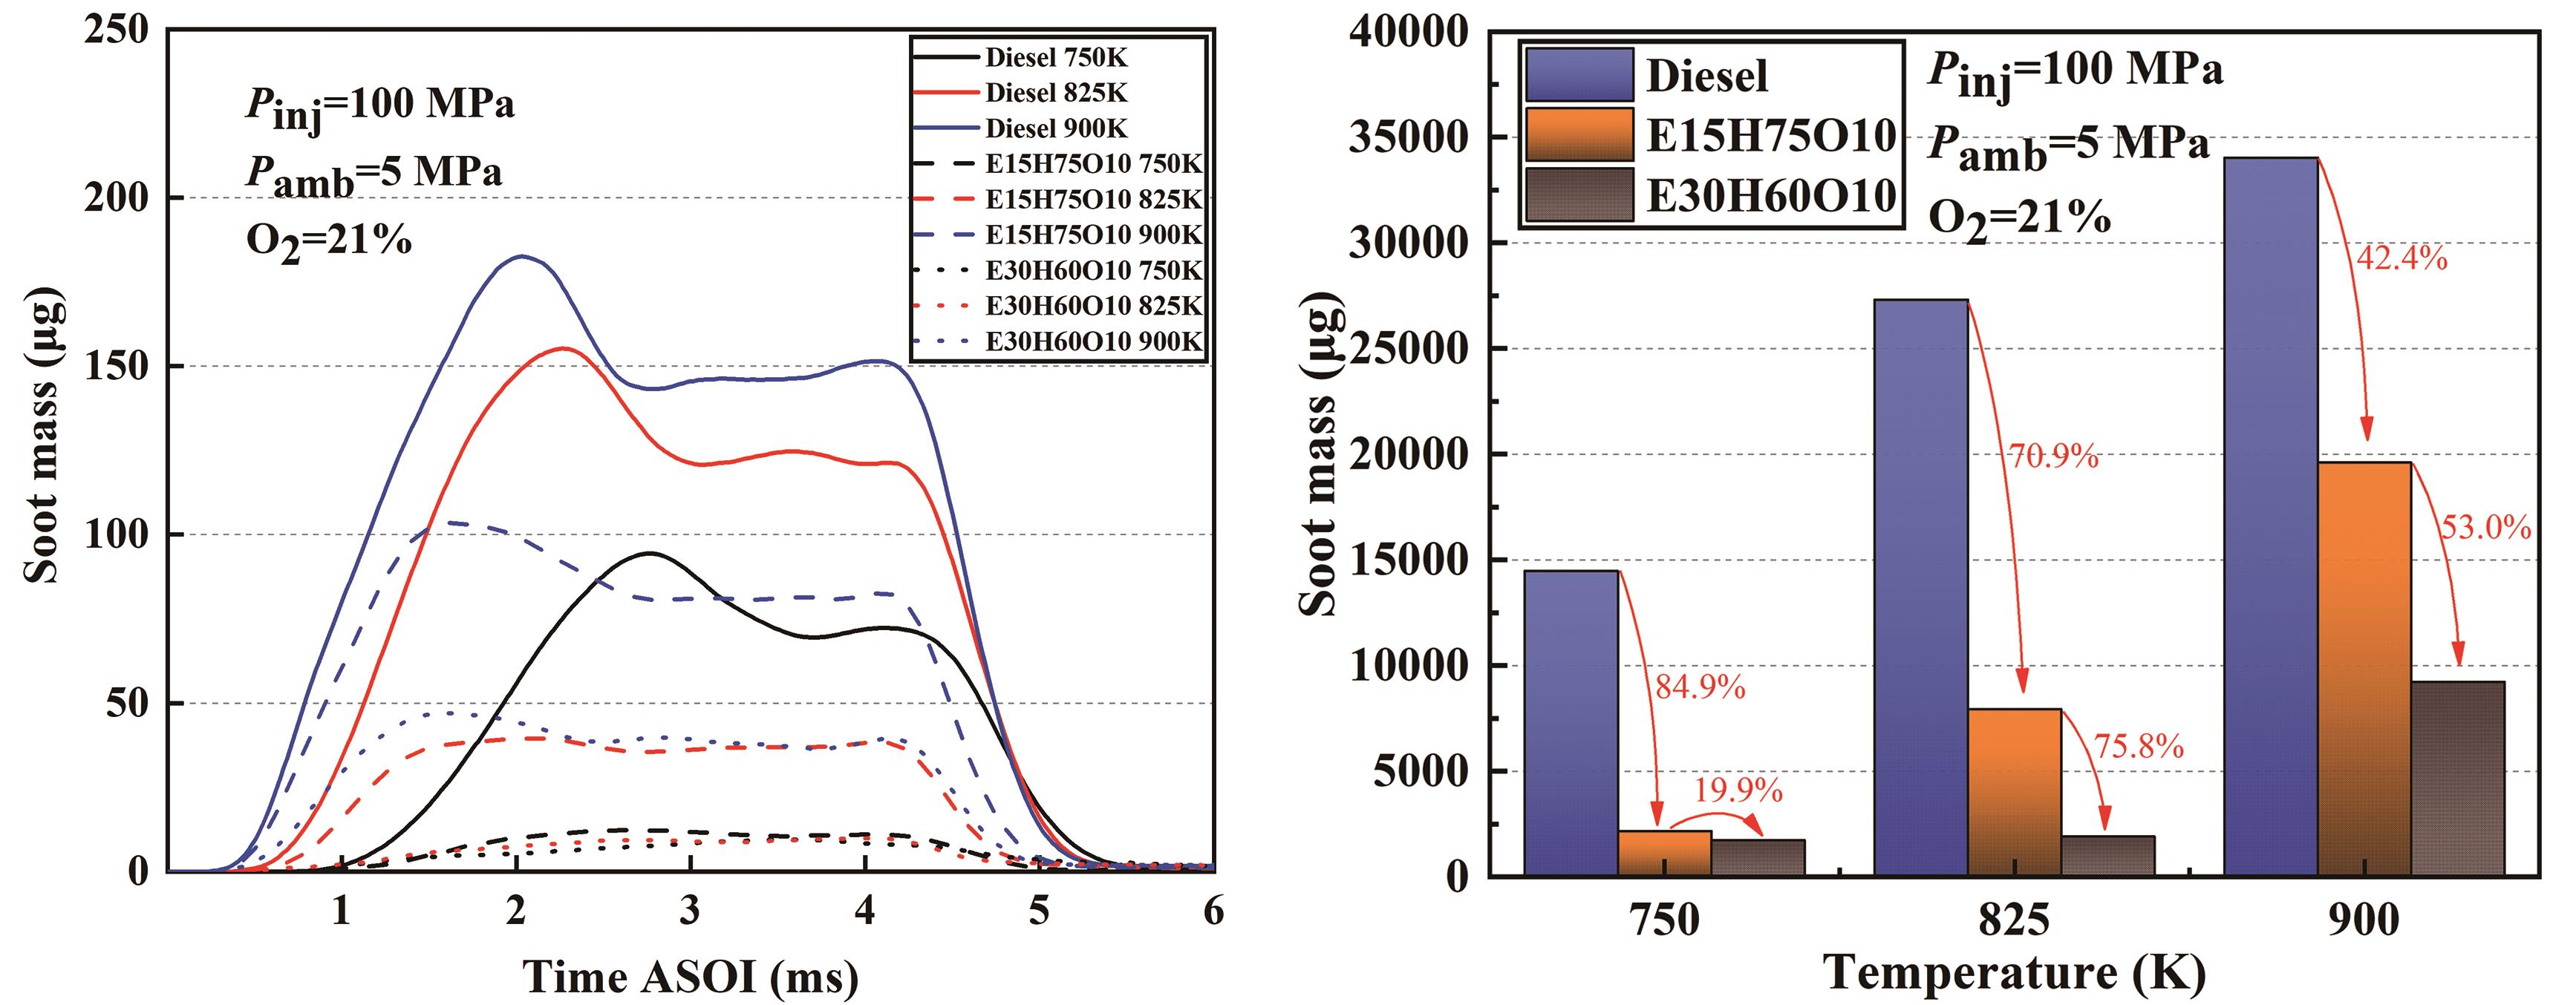
Figure 9. Development of soot generation quality of three fuels at different ambient temperatures.
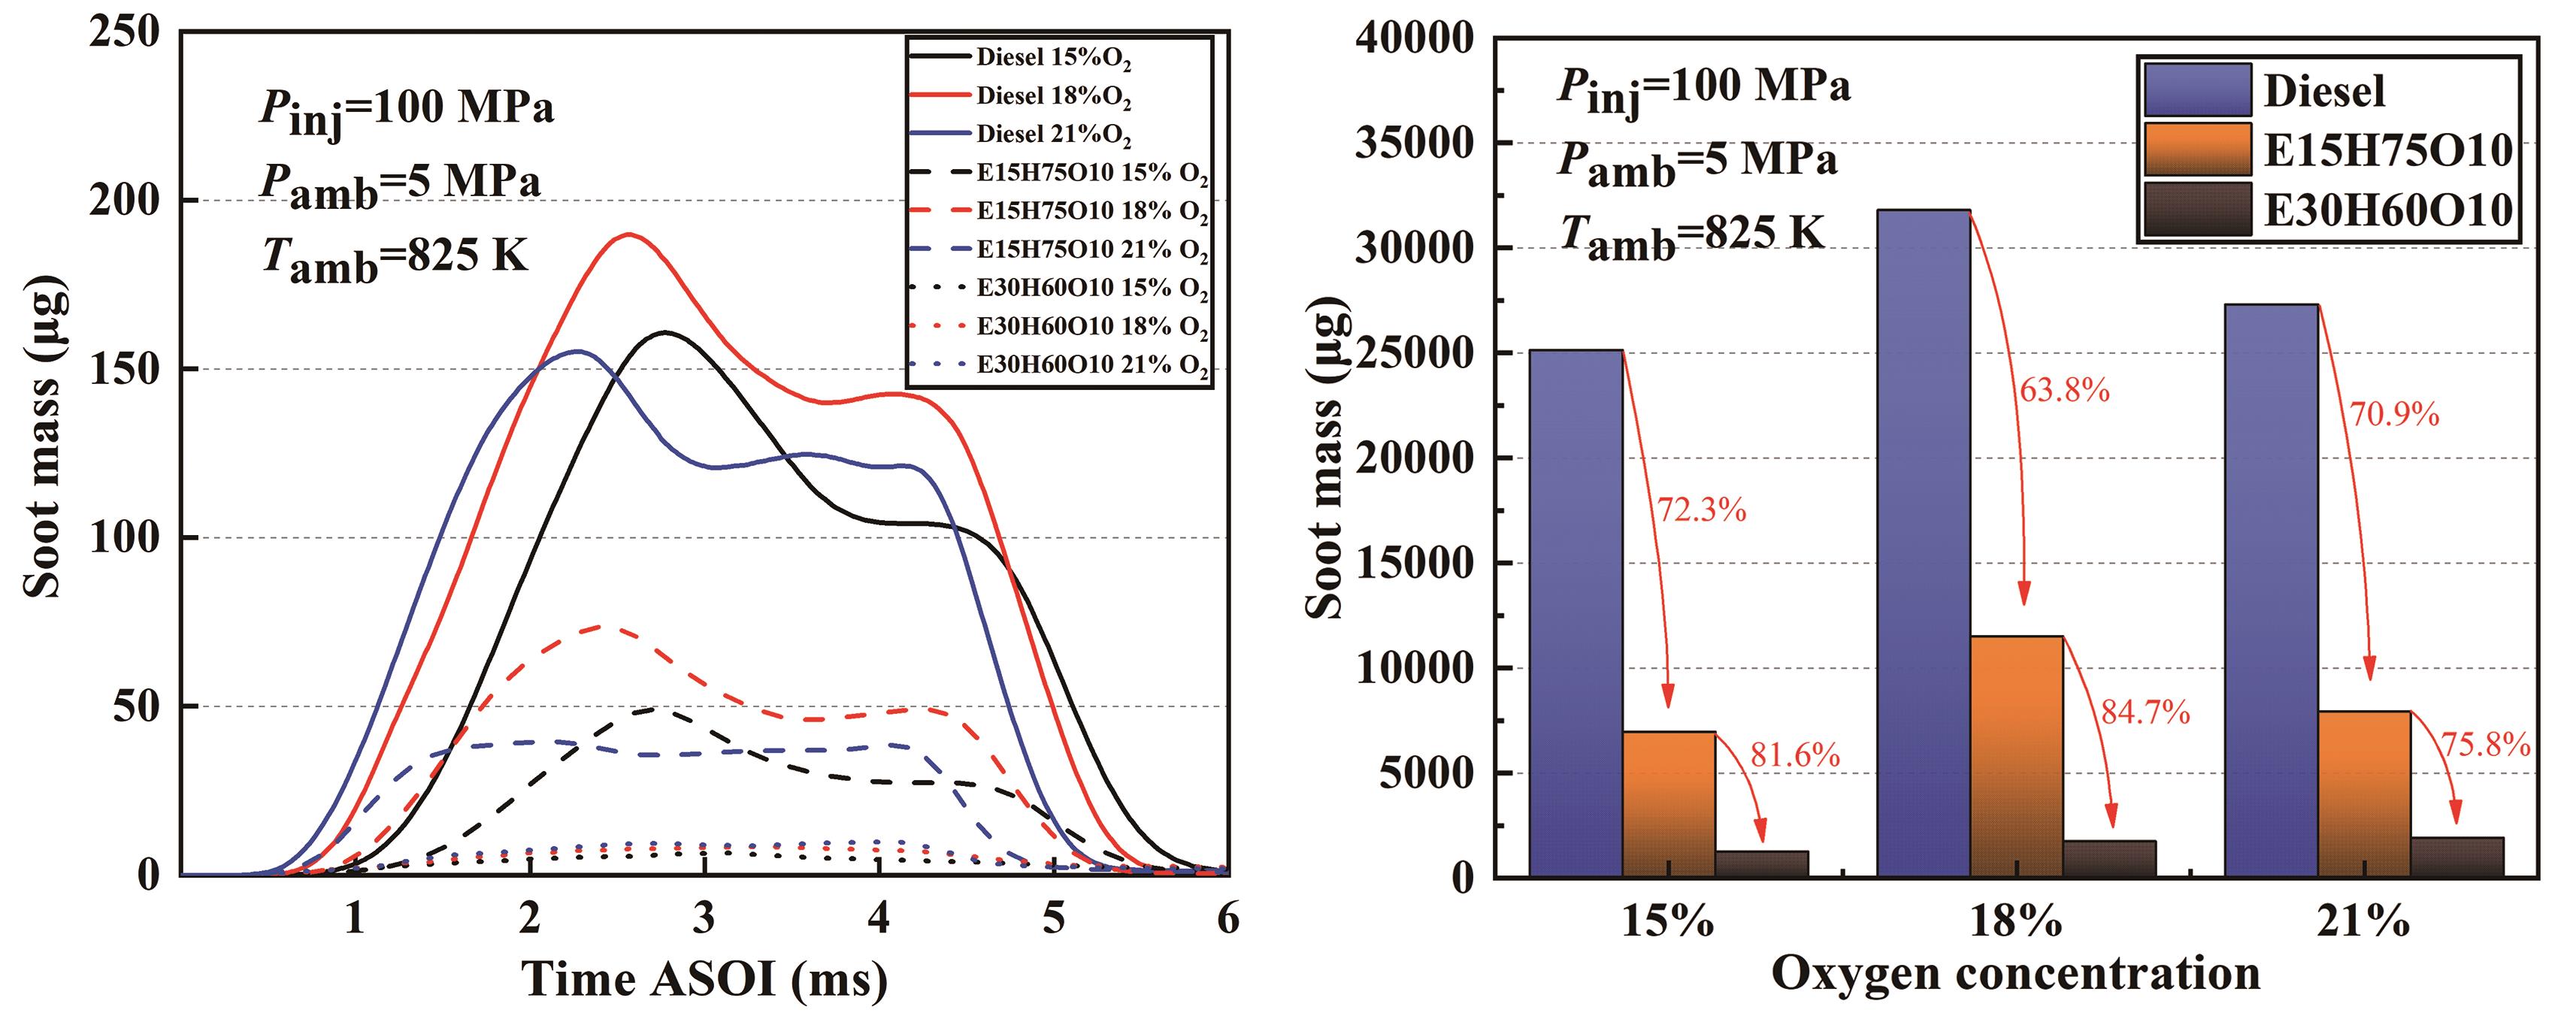
Figure 10. Development of soot generation mass for three fuels at different ambient oxygen concentrations.
Figure 10 presents the development of soot generation mass for three fuels at different ambient oxygen concentrations. Compared with previous studies, the generation of soot is directly proportional to the ambient temperature, which is consistent with the findings of this paper. However, the soot generation regularity becomes relatively complicated at different oxygen concentrations. The column graphs clearly indicate that the cumulative soot mass for both the Diesel and E15H75O10 blends peaks at an ambient oxygen concentration of 18%. While the cumulative soot mass of the E30H60O10 blend rises proportionally with the ambient oxygen concentration, the whole soot mass is much less. The reason for this is that the quantity of generated soot is determined by the discrepancy between the rates of soot generation and oxidation. For both Diesel and E15H75O10 blended fuels, at an ambient oxygen concentration of 15%, the limited oxygen content yields a sluggish chemical reaction rate, resulting in lower flame temperature and reduced soot generation rate. Consequently, the net soot production is lower than that at an ambient oxygen concentration of 18%. Conversely, at an ambient oxygen concentration of 21%, the heightened chemical reaction rate and increased flame temperature accelerate the rate of soot oxidation, surpassing the rate of generation. This leads to diminished soot levels compared to an ambient oxygen concentration of 18%. In the case of E30H60O10 blended fuels, due to its high oxygen content and excellent atomization effect, and as the oxygen concentration increases, the flame temperature also increases, resulting in the generation of more soot.
Figure 11 illustrates the progression of soot generation rates for the three test fuels at varying ambient temperatures and oxygen concentrations. As evident from the figure, higher ambient temperature not only amplifies the quantity of soot produced but also augments the rate of soot generation. Under equivalent conditions, the inclusion of ethanol prominently diminishes the rate of soot generation, the degree of reduction becoming more noticeable as the quantity of ethanol rises. However, at different ambient oxygen concentrations, the soot generation rates are very close to each other, but the introduction of ethanol leads to a reduction in the soot generation rate. Overall, the inclusion of ethanol has been found to significantly reduce the rate at which soot is produced. The impact of ambient temperature on this rate is more significant compared to the influence of ambient oxygen concentration.
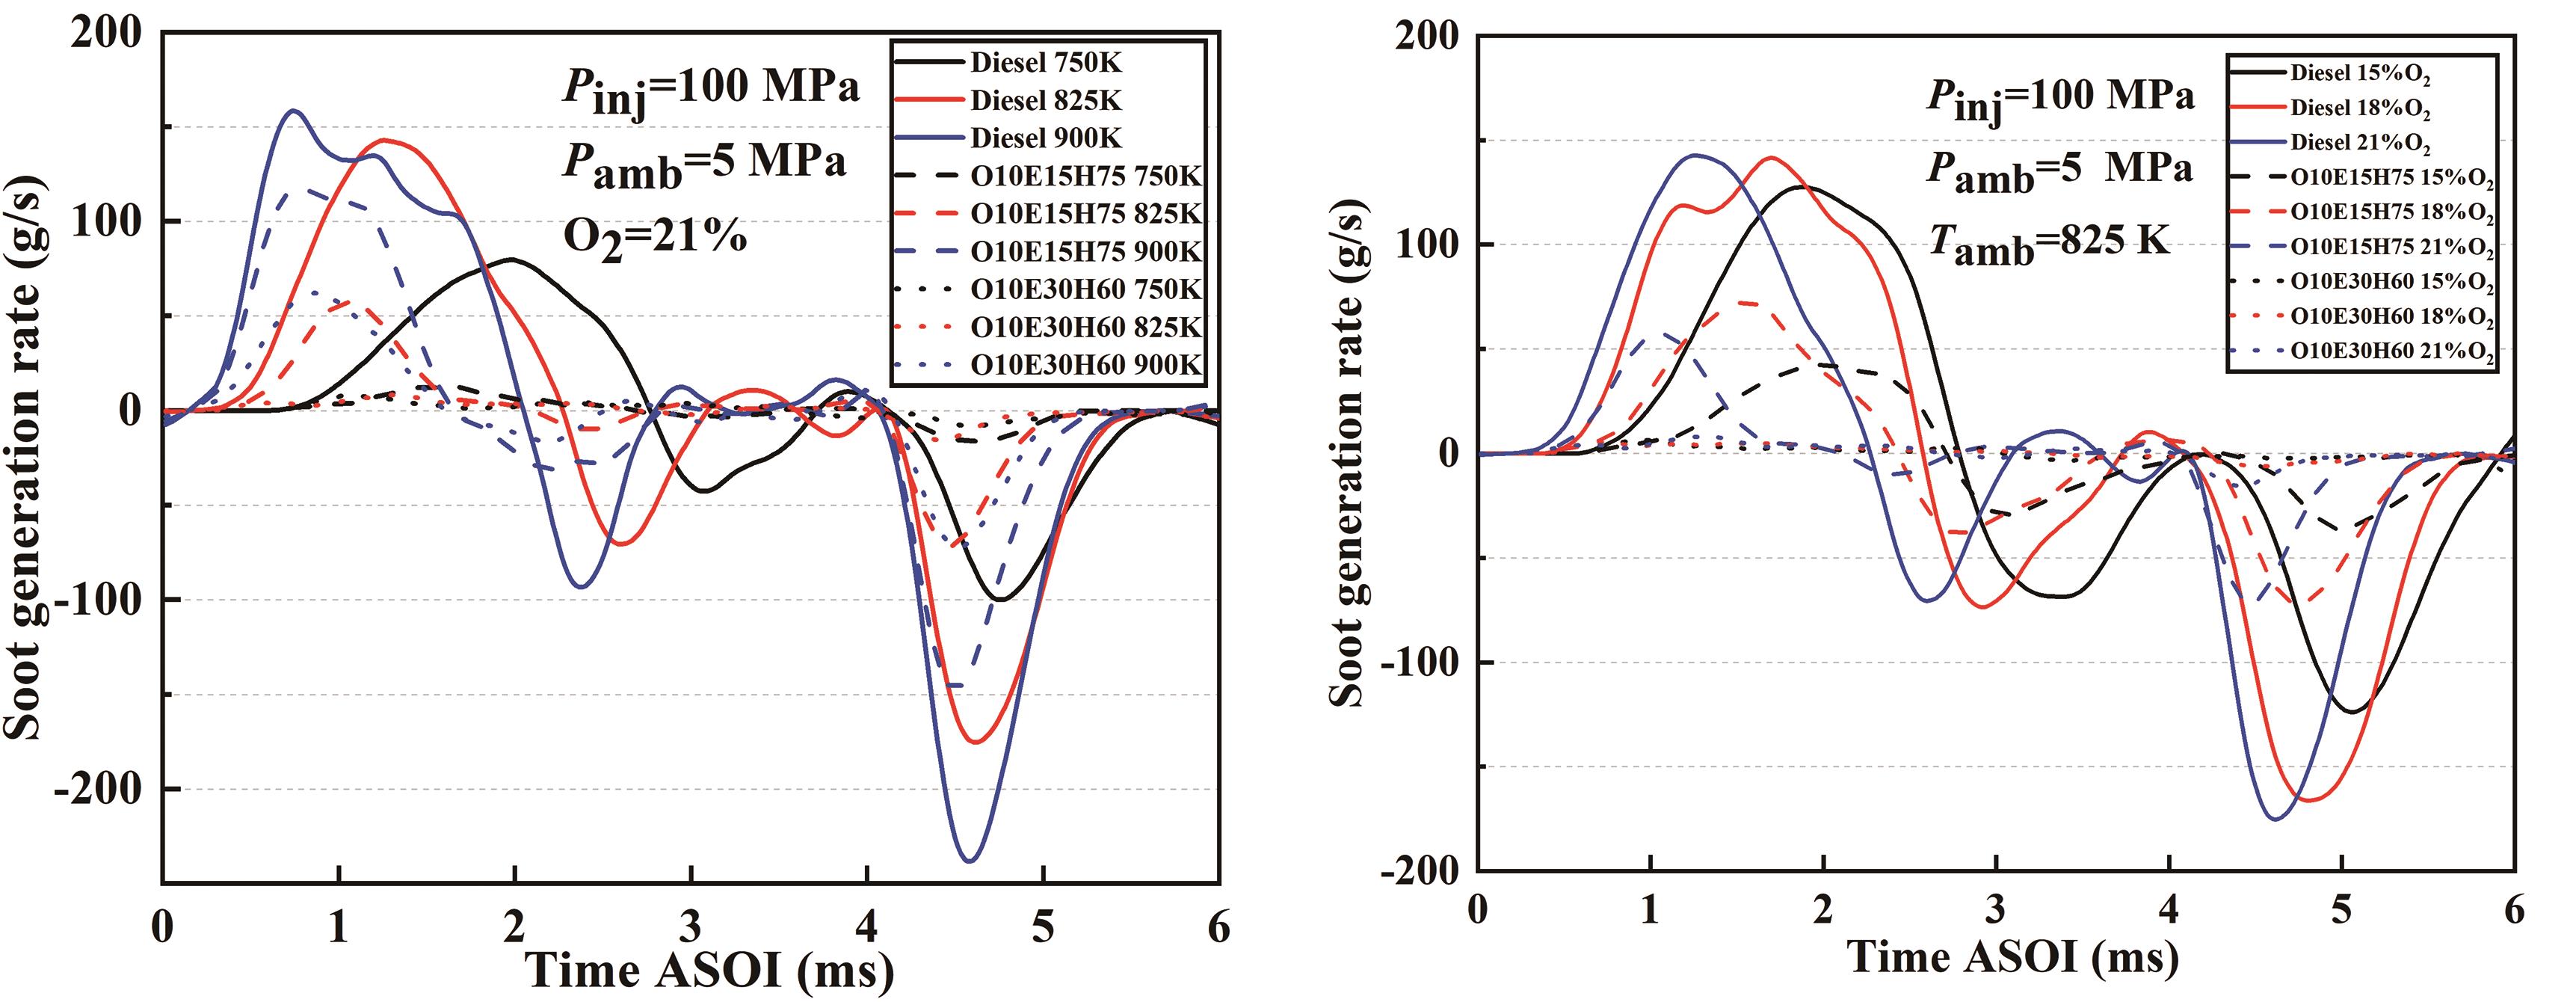
Figure 11. Development of soot generation rates for three fuels at different temperatures and ambient oxygen concentrations.
Figure 12 shows the development of soot generation mass with time for E30H60O10 blended fuel at different injection pressures. Notably, at an injection pressure of 50 MPa, the peak soot generation reaches approximately 12.5 μg. However, increasing the injection pressure to 100 MPa tends to reduce peak soot generation of around 6 μg, signifying a reduction of over 50% by doubling the injection pressure. Therefore, the increase in injection pressure has a significant effect on the soot reduction. Two factors contribute to this phenomenon. Firstly, increased injection pressure enhances the spray atomization, leading to more thorough combustion and increased oxidation of soot particles. Secondly, the intensified spray swirl resulting from higher injection pressure introduces a greater volume of air into the central combustion reaction's zone, lowering the equivalence ratio in that area and further reducing the amount of soot generation.
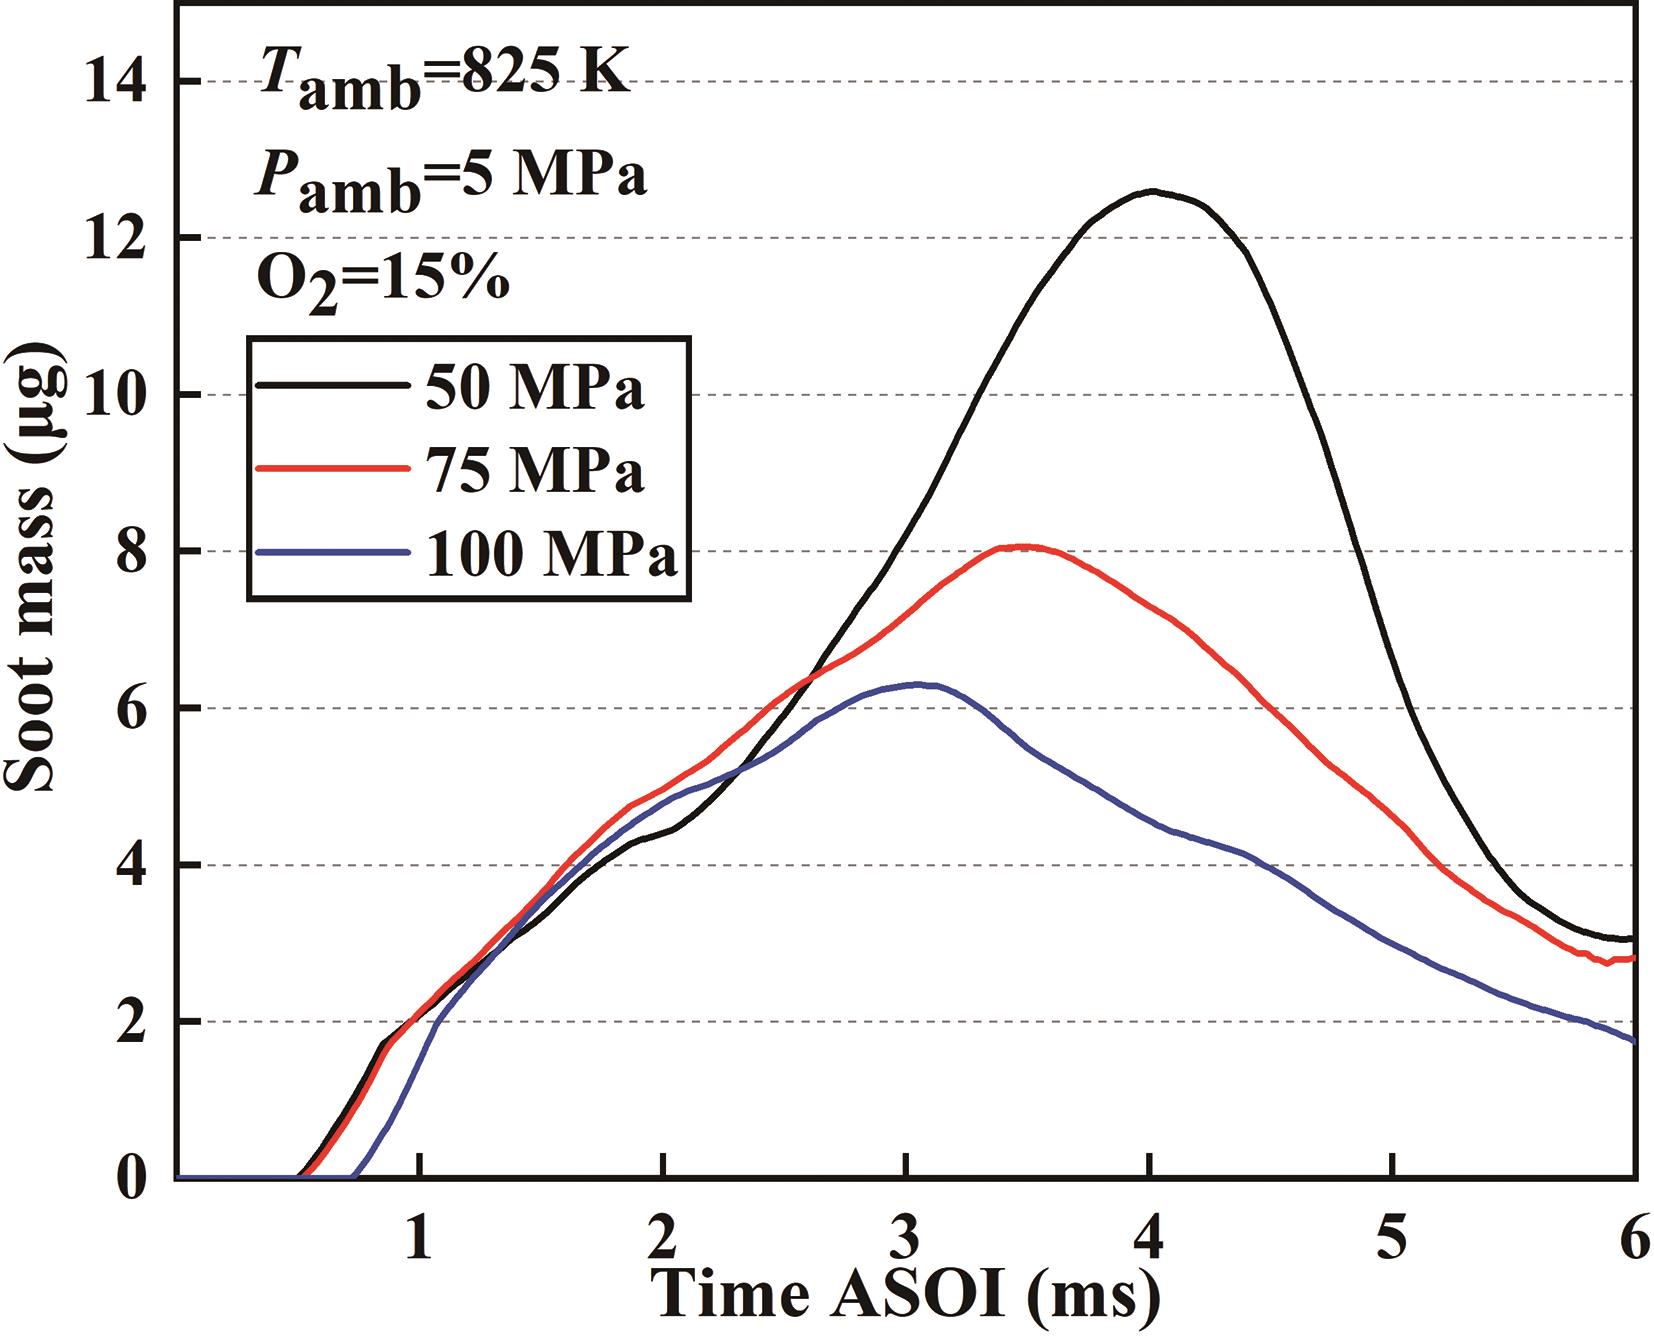
Figure 12. Development of soot generation mass for E30H60O10 blend at different injection pressures.
Figure 13 shows the development of soot area with time for the three test fuels at different ambient temperatures and ambient oxygen concentrations. It can be seen that under the corresponding conditions, the trend of soot area and mass versus time for the three fuels is almost the same, with a peak due to a large accumulated amount of soot caused by the lack of oxygen inside the flame, and then entering a relatively smooth period. When compared under identical conditions, the increase of ethanol in the blend yields a notable reduction in soot area. For instance, the soot area exhibited by the E30H60O10 blended fuel at 900 K nearly equals that of the E15H75O10 blended fuel at 825 K. This observation underscores the substantial impact of ethanol blending on soot mitigation. Through the analysis of soot generation and considering the effect of the high latent heat of vaporization of ethanol on the ignition characteristics, the optimum blending ratio of ethanol is around 20%.
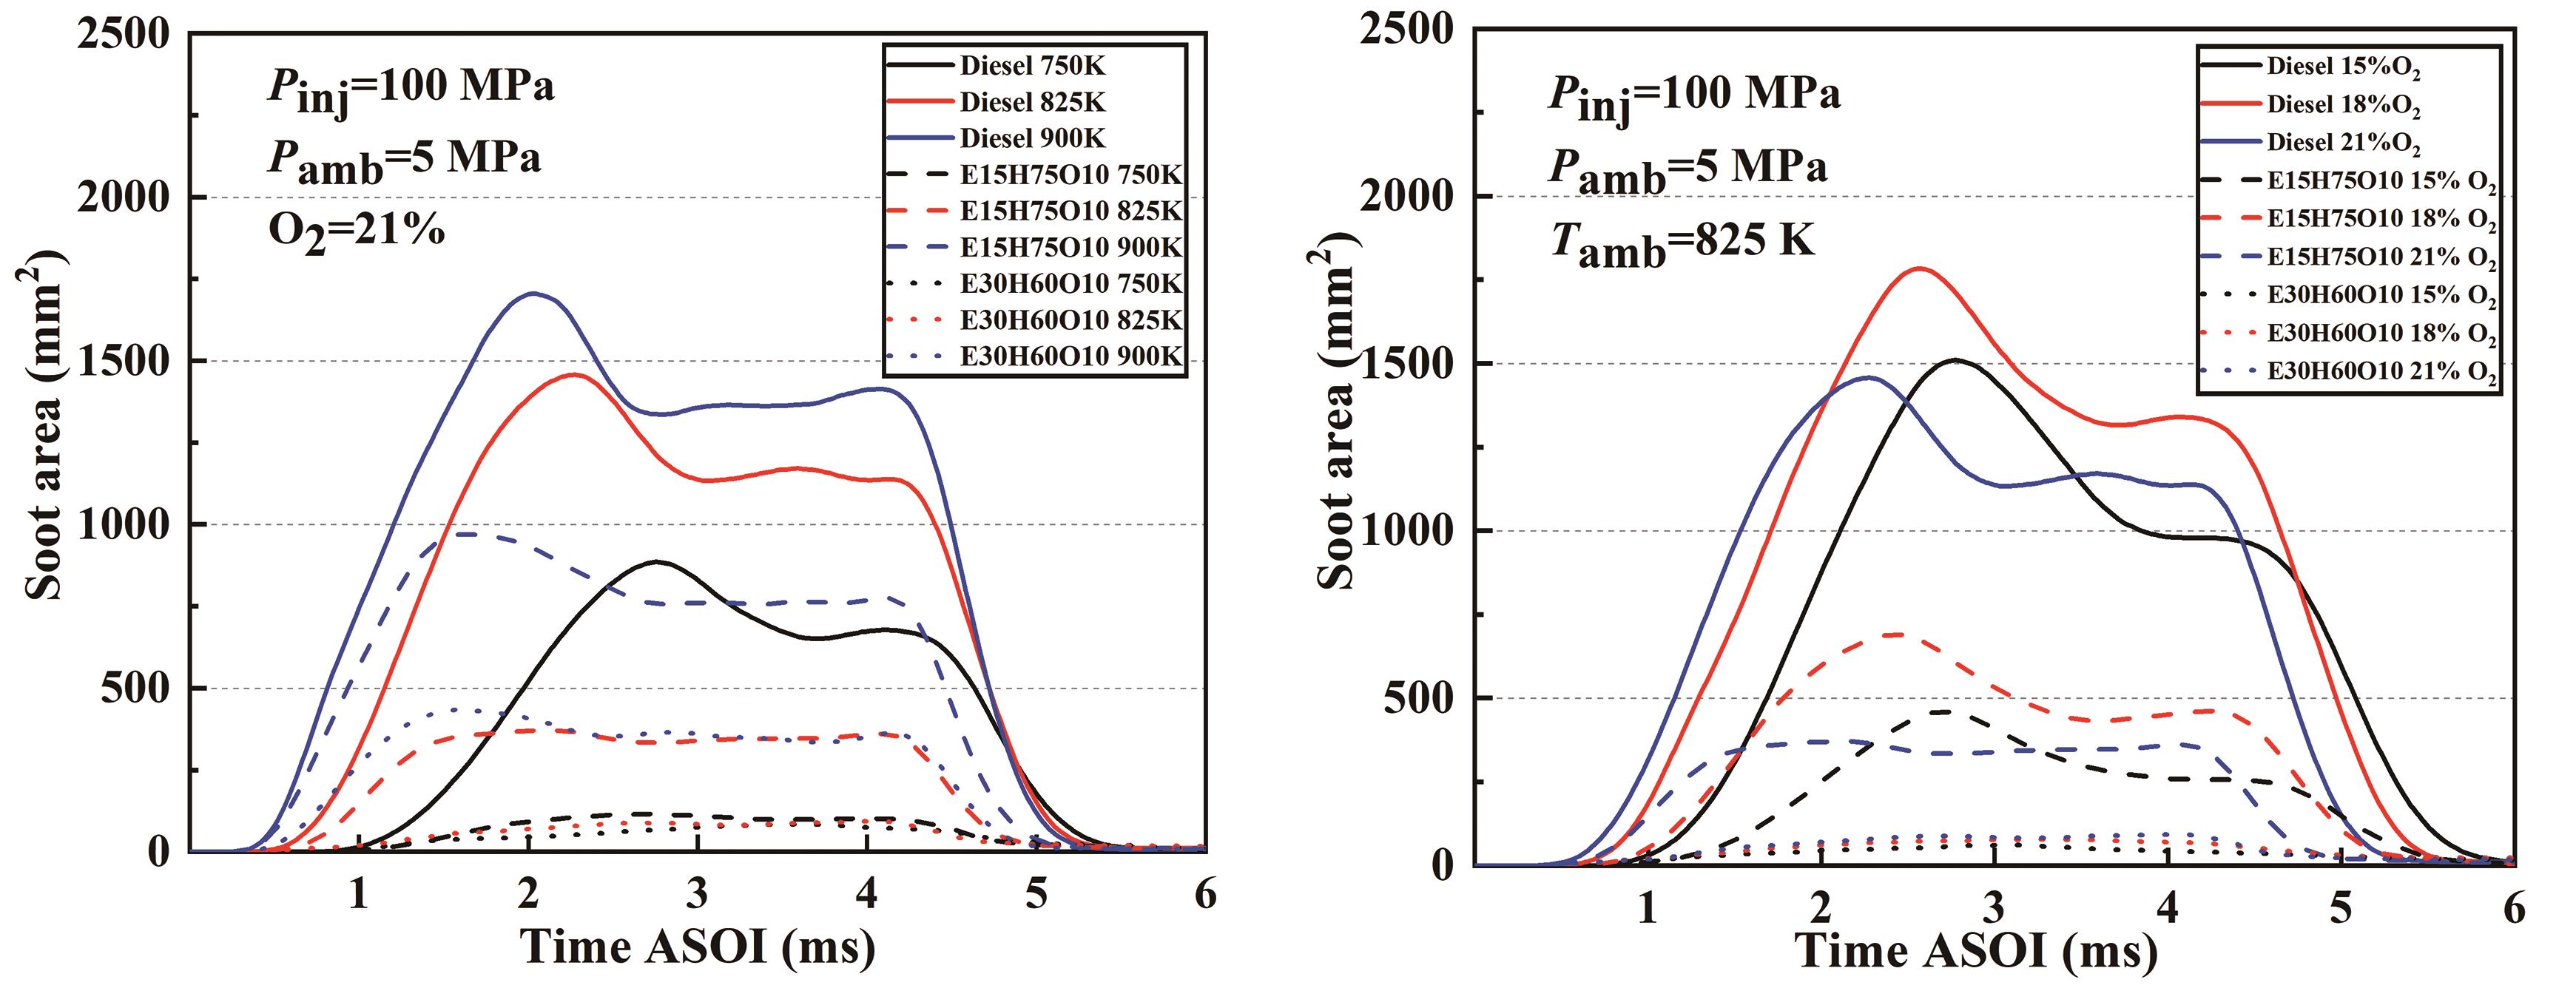
Figure 13. Development of soot area with time for the three fuels at different ambient temperatures and different ambient oxygen concentrations.
4. Conclusions
This paper mainly investigates the transient distribution characteristics of soot concentration of Diesel, E15H75O10 and E30H60O10 fuels and the quantitative measurement of respective soot generation mass and area in a constant volume combustion chamber system using high-frequency background light extinction method under different ambient temperatures, different ambient oxygen concentrations and different injection pressures, and conducts a comparative analysis under different conditions. The main conclusions of the investigation are as follows:
(1) The transient soot concentrations of Diesel are higher than E15H75O10 and E30H60O10 blends, and the addition of ethanol effectively reduces the total soot concentration of the fuel. In the process of soot development, there will be a similar "spindle", because the fuel internal equivalence ratio is very high, the oxidant is blocked by the flame in the periphery and cannot enter the flame central area, which makes it difficult to oxidize the soot. A large amount of soot accumulation, and ethanol's oxygen characteristics largely alleviate the high temperature oxygen deprivation, which is conducive to the oxidation of soot.
(2) As the proportion of ethanol in the fuel blend increases, the initial time of soot generation is delayed and the initial location of soot increases correspondingly. The impact of different ambient temperatures on the initial time and location of soot formation varies: at 750 K, the latent heat of vaporization outweighs the influence of Cetane Number, and as the temperature increases, the effect of the Cetane Number is dominant; the effect of decreasing oxygen concentration on increasing the initial time and location is greater than the effect of increasing ambient temperature on decreasing the initial time and location.
(3) The impact of elevated temperature on both the mass and area of soot exceeded that of higher oxygen concentration. The increase in soot generation due to increasing ambient temperature could be effectively resolved by increasing the ethanol blending ratio. The incorporation of ethanol notably curtailed the rate of soot generation, with ambient temperature exerting a more pronounced influence on this rate than ambient oxygen concentration. By scrutinizing soot generation and considering the influence of ethanol's high latent heat of vaporization on ignition characteristics, the optimal blending ratio of ethanol is around 20%, and then increasing injection pressure can further reduce the soot generation.
Author Contributions: Methodology, F.Y. and J.C.; formal analysis, W.Z. and S.Z.; investigation, J.C.; resources, Z.H. and Q.W.; data curation, S.Z., Q.L. and F.Y.; writing—original draft preparation, W.Z. and S.Z.; writing—review and editing, W.Z. and T.P.; supervision, Z.H. and Q.W.; project administration, Z.H. All authors have read and agreed to the published version of the manuscript.
Funding: This research was supported by the National Natural Science Foundation of China [No. 52076103, 51876083], Research Innovation Plan for Postgraduates in Jiangsu Universities of China [KYCX21_3350], China Postdoctoral Science Foundation [2021M692964].
Data Availability Statement: Statement: Not applicable.
Conflicts of Interest: The authors declare no conflict of interest.
References
- Samson, A.O.; Babatunde, O.M.; Denwigwe, I.H. Powering a space environment research laboratory (SERL): hybrid renewable energy system or diesel system? Energy Engineering 2019, 116(2), 41–64. DOI: https://doi.org/10.1080/01998595.2019.12054404
- Wang, S.; Karthickeyan, V.; Sivakumar, E.; et al. Experimental investigation on pumpkin seed oil methyl ester blend in diesel engine with various injection pressure, injection timing and compression ratio. Fuel 2020, 264, 116868. DOI: https://doi.org/10.1016/j.fuel.2019.116868
- Saravanan, A.P.; Mathimani, T.; Deviram, G.; et al. Biofuel policy in India: a review of policy barriers in sustainable marketing of biofuel. Journal of Cleaner Production 2018, 193, 734–747. DOI: https://doi.org/10.1016/j.jclepro.2018.05.033
- Chen, H.; Su, X.; Li, J.; et al. Effects of gasoline and polyoxymethylene dimethyl ethers blending in diesel on the combustion and emission of a common rail diesel engine. Energy 2019, 171, 981–999. DOI: https://doi.org/10.1016/j.energy.2019.01.089
- Han, W.; Lu, Y.; Jin, C.; et al. Study on influencing factors of particle emissions from a RCCI engine with variation of premixing ratio and total cycle energy. Energy 2020, 202, 117707. DOI: https://doi.org/10.1016/j.energy.2020.117707
- Zhang, P.; He, J.; Chen, H.; et al. Improved combustion and emission characteristics of ethylene glycol/diesel dual-fuel engine by port injection timing and direct injection timing. Fuel Processing Technology 2020, 199, 106289. DOI: https://doi.org/10.1016/j.fuproc.2019.106289
- Gómez, A.; Soriano, J.A.; Armas, O. Evaluation of sooting tendency of different oxygenated and paraffinic fuels blended with diesel fuel. Fuel 2016, 184, 536–543. DOI: https://doi.org/10.1016/j.fuel.2016.07.049
- Guan, C.; Cheung, C.S.; Li, X.; et al. Effects of oxygenated fuels on the particle-phase compounds emitted from a diesel engine. Atmospheric Pollution Research 2017, 8(2), 209–220. DOI: https://doi.org/10.1016/j.apr.2016.08.005
- Zhang, P.; Su, X.; Yi, C.; et al. Spray, atomization and combustion characteristics of oxygenated fuels in a constant volume bomb: A review. Journal of Traffic and Transportation Engineering (English Edition) 2020, 7(3), 282–297. DOI: https://doi.org/10.1016/j.jtte.2020.05.001
- Xuan, T.; Sun, Z.; EL-Seesy, A.I.; et al. An optical study on spray and combustion characteristics of ternary hydrogenated catalytic biodiesel/methanol/n-octanol blends; part П: Liquid length and in-flame soot. Energy 2021, 227, 120543. DOI: https://doi.org/10.1016/j.energy.2021.120543
- Zhong, W.; Yuan, Q.; Xiang, Q.; et al. Experimental Study on Soot Formation Characteristics of Pentanol/N-Dodecane Blends. Chinese Internal Combustion Engine Engineering 2022, 43(2), 20–29.
- Larsen, U.; Johansen, T.; Schramm, J. Ethanol as a future fuel for road transportation: Main report. DTU Mekanik. 2009. Available online: https://backend.orbit.dtu.dk/ws/portalfiles/portal/5237040/annex35report_final.pdf (Accessed on 5 September 2023).
- U.S. Department of Energy. Biodiesel Benefits and Considerations. Available online: https://afdc.energy.gov/fuels/biodiesel_benefits.html (Accessed on 5 September 2023).
- Chen, R.H.; Chiang, L.B.; Chen, C.N.; et al. Cold-start emissions of an SI engine using ethanol–gasoline blended fuel. Applied Thermal Engineering 2011, 31(8–9), 1463–1467. DOI: https://doi.org/10.1016/j.applthermaleng.2011.01.021
- da Costa, R.B.R.; Valle, R.M.; Hernández, J.J.; et al. Experimental investigation on the potential of biogas/ethanol dual-fuel spark-ignition engine for power generation: Combustion, performance and pollutant emission analysis. Applied Energy 2020, 261, 114438. DOI: https://doi.org/10.1016/j.apenergy.2019.114438
- Zhou, Z.; Yan, F.; Zhang, G.; et al. A Study on the Dynamic Collision Behaviors of a Hydrous Ethanol Droplet on a Heated Surface. Processes 2023, 11(6), 1804. DOI: https://doi.org/10.3390/pr11061804
- Zervas, E.; Montagne, X.; Lahaye, J. C1− C5 organic acid emissions from an SI engine: Influence of fuel and air/fuel equivalence ratio. Environmental Science & Technology 2001, 35(13), 2746–2751. DOI: https://doi.org/10.1021/es000237v
- Guo, R.; Bao, X.; Yue, X.; et al. The Influence of Ethanol Gasoline on Deposit Formation in Intake System of the Engine. Automotive Engineering 2007, 8(8), 642–644,691. (In Chinese)
- Öztürk, E.; Can, Ö. Effects of EGR, injection retardation and ethanol addition on combustion, performance and emissions of a DI diesel engine fueled with canola biodiesel/diesel fuel blend. Energy 2022, 244, 123129. DOI: https://doi.org/10.1016/j.energy.2022.123129
- Janakiraman, S.; Lakshmanan, T.; Raghu, P. Experimental investigative analysis of ternary (diesel+ biodiesel+ bio-ethanol) fuel blended with metal-doped titanium oxide nanoadditives tested on a diesel engine. Energy 2021, 235, 121148. DOI: https://doi.org/10.1016/j.energy.2021.121148
- Zheng, Z.; Wang, X.; Zhong, X.; et al. Experimental study on the combustion and emissions fueling biodiesel/n-butanol, biodiesel/ethanol and biodiesel/2, 5-dimethylfuran on a diesel engine. Energy 2016, 115, 539–549. DOI: https://doi.org/10.1016/j.energy.2016.09.054
- Padala, S.; Woo, C.; Kook, S.; et al. Ethanol utilisation in a diesel engine using dual-fuelling technology. Fuel 2013, 109, 597–607. DOI: https://doi.org/10.1016/j.fuel.2013.03.049
- Shadidi, B.; Alizade, H.H.A.; Najafi, G. The Influence of Diesel–Ethanol Fuel Blends on Performance Parameters and Exhaust Emissions: Experimental Investigation and Multi-Objective Optimization of a Diesel Engine. Sustainability 2021, 13(10), 5379. DOI: https://doi.org/10.3390/su13105379
- Chen, Z.; He, J.; Chen, H.; et al. Comparative study on the combustion and emissions of dual-fuel common rail engines fueled with diesel/methanol, diesel/ethanol, and diesel/n-butanol. Fuel 2021, 304, 121360. DOI: https://doi.org/10.1016/j.fuel.2021.121360
- Kurre, S.K.; Pandey, S.; Garg, R.; et al. Experimental study of the performance and emission of diesel engine fueled with blends of diesel–ethanol as an alternative fuel. Biofuels 2015, 6(3–4), 209–216. DOI: https://doi.org/10.1080/17597269.2015.1078561
- An, H.; Yang, W.M.; Maghbouli, A.; et al. Performance, combustion and emission characteristics of biodiesel derived from waste cooking oils. Applied Energy 2013, 112, 493–499. DOI: https://doi.org/10.1016/j.apenergy.2012.12.044
- Lapuerta, M.; Rodríguez-Fernández, J.; Agudelo, J.R. Diesel particulate emissions from used cooking oil biodiesel. Bioresource Technology 2008, 99(4), 731–740. DOI: https://doi.org/10.1016/j.biortech.2007.01.033
- Aatola, H.; Larmi, M.; Sarjovaara, T.; et al. Hydrotreated vegetable oil (HVO) as a renewable diesel fuel: trade-off between NOₓ, particulate emission, and fuel consumption of a heavy duty engine. SAE International Journal of Engines 2009, 1(1), 1251–1262. DOI: https://doi.org/10.4271/2008-01-2500
- Zhai, C.; Zhang, G.; Jin, Y.; et al. Characterization of diesel spray combustion using two-color pyrometry and OH∗ chemiluminescence imaging-comparison between micro-hole and ultra-high injection pressure effects. Journal of the Energy Institute 2022, 103, 104–116. DOI: https://doi.org/10.1016/j.joei.2022.05.012
- Zhong, W.; Pachiannan, T.; Li, Z.; et al. Combustion and emission characteristics of gasoline/hydrogenated catalytic biodiesel blends in gasoline compression ignition engines under different loads of double injection strategies. Applied Energy 2019, 251, 113296. DOI: https://doi.org/10.1016/j.apenergy.2019.05.099
- Zhong, W.; Xiang, Q.; Pachiannan, T.; et al. Experimental study on in-flame soot formation and soot emission characteristics of gasoline/hydrogenated catalytic biodiesel blends. Fuel 2021, 289, 119813. DOI: https://doi.org/10.1016/j.fuel.2020.119813
- Payri, R.; Gimeno, J.; Cardona, S.; et al. Measurement of Soot Concentration in a Prototype Multi-Hole Diesel Injector by High-Speed Color Diffused Back Illumination Technique. SAE Technical Paper 2017, No. 2017-01-2255. DOI: https://doi.org/10.4271/2017-01-2255
- Pickett, L.M.; Siebers, D.L. Soot in diesel fuel jets: effects of ambient temperature, ambient density, and injection pressure. Combustion and Flame 2004, 138(1–2), 114–135. DOI: https://doi.org/10.1016/j.combustflame.2004.04.006
- Manin, J.L.; Pickett, L.M. Extinction-based Imaging of Soot Processes over a Range of Diesel Operating Conditions (No. SAND2013-2181C). Sandia National Lab. (SNL-CA), Livermore, CA (United States). 2013. Available online: https://www.osti.gov/servlets/purl/1145329 (Accessed on 5 September 2023)
- Ramírez-Verduzco, L.F.; Rodríguez-Rodríguez, J.E.; del Rayo Jaramillo-Jacob, A. Predicting cetane number, kinematic viscosity, density and higher heating value of biodiesel from its fatty acid methyl ester composition. Fuel 2012, 91(1), 102–111. DOI: https://doi.org/10.1016/j.fuel.2011.06.070
- Tipanluisa, L.; Fonseca, N.; Casanova, J.; et al. Effect of n-butanol/diesel blends on performance and emissions of a heavy-duty diesel engine tested under the World Harmonised Steady-State cycle. Fuel 2021, 302, 121204. DOI: https://doi.org/10.1016/j.fuel.2021.121204
- Moffat, R.J. Describing the uncertainties in experimental results. Experimental Thermal and Fluid Science 1988, 1(1), 3–17. DOI: https://doi.org/10.1016/0894-1777(88)90043-X


